
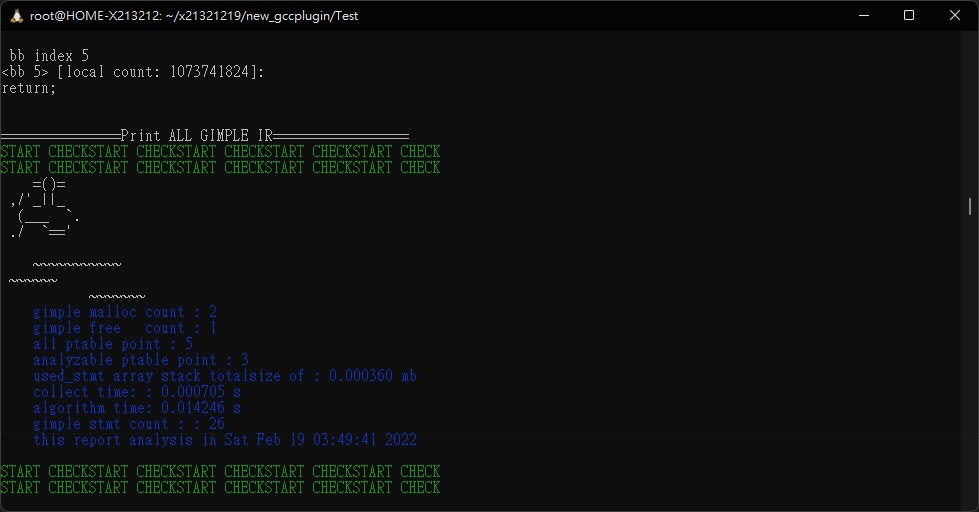
花了兩年在gcc plugin 構建一個靜態分析器. https://github.com/x213212/Static-analyzer-in-gccplugin
Table of contents
[toc]
Introduction
Use GCC PLUGIN to implement a static analyzer to help users detect memory deallocation errors, including memleak, double free, use-after-free, and currently experimental nature of symbolic execution and pthread resouce leak detection.
Install
Install gcc-12-plugin-dev with the end of plugin-dev version of gcc or you can compile it yourself
sudo apt-get -y install gcc-12-plugin-dev
Custom GCC version
Modify the respective makefile files under each directory
/Compiler/Makefile
/Test/Makefile
/Makefile
Change CC to Custom version
CC=gcc-11.2 // other version
Compile
You can find the newplugin.so generated in /Compiler/ and the check.log generated in /Test/check.log to analyze the report.
make
Use
A simple test can be found in /Test/test.c
unittest check single file test
cd Test
# mod 1
# # $(CC) $(PLUGIN) $(FLAGS) $(LTO)  $(FILE_NAME) -o $@
$(CC) $(PLUGIN) $(FLAGS) $(LTO)   $(FILE_NAME) -o $@ 2> check.log
@sh ./test.sh $(FILE_NAME)
test.c
int main(void)
{
    int *a;
    int test;
    a = foo();
    if (test)
        a[2] = 10;
    else
    {
        a = (int *)malloc(40);
        free(a);
    }
    free(a);
}
run!
cd ..
make
cat /Test/check.log
Experiment
unittest check memory error detect
The experiments were tested using the Juliet Test Suite (NSA Center for Reassurance Software) and the Benchmarks provided by Memfix .
cd Test
# mod 2
# binutils
-$(CC) $(PLUGIN) $(FLAGS) $(LTO)   $(BFILE_NAME1)  -o $@ 2> $(BINUTILSL)1/check.log
-$(CC) $(PLUGIN) $(FLAGS) $(LTO)   $(BFILE_NAME2)  -o $@ 2> $(BINUTILSL)2/check.log
-$(CC) $(PLUGIN) $(FLAGS) $(LTO)   $(BFILE_NAME3)  -o $@ 2> $(BINUTILSL)3/check.log
-$(CC) $(PLUGIN) $(FLAGS) $(LTO)   $(BFILE_NAME4)  -o $@ 2> $(BINUTILSL)4/check.log
-$(CC) $(PLUGIN) $(FLAGS) $(LTO)   $(BFILE_NAME5)  -o $@ 2> $(BINUTILSL)5/check.log
-$(CC) $(PLUGIN) $(FLAGS) $(LTO)   $(BFILE_NAME6)  -o $@ 2> $(BINUTILSL)6/check.log
-$(CC) $(PLUGIN) $(FLAGS) $(LTO)   $(BFILE_NAME7)  -o $@ 2> $(BINUTILSL)7/check.log
-$(CC) $(PLUGIN) $(FLAGS) $(LTO)   $(BFILE_NAME8)  -o $@ 2> $(BINUTILSL)8/check.log
-$(CC) $(PLUGIN) $(FLAGS) $(LTO)   $(BFILE_NAME9)  -o $@ 2> $(BINUTILSL)9/check.log
-$(CC) $(PLUGIN) $(FLAGS) $(LTO)   $(BFILE_NAME10)  -o $@ 2> $(BINUTILSL)10/check.log
///
.... more testcase ...
///
memory deallocation error run!
cd ..
make
cat /Test/check.log
You can test the analyzer for errors by using the following commands.
unittest check expand gimple ir no error
Most of the Please submit a full bug report errors occur because the parser tree expands or the parser crashes due to incorrect use of commands.
cd Test
//memory leak
make unittest
unittest check gimple ir incomplete
This part of the error occurs because there is no complete code to generate the object file, but it is possible to analyze it if the code is incomplete.
cd Test
//memory leak
make undeffun
Juliet_Test_Suite
To test Juliet_Test_Suite please enable flag. in the /Test/Makefile
-fplugin-arg-newplugin-retnotheapobjskipcheck=1
Turn on this flag to detect when the code is incomplete.
memory leak
cp ./Compiler/newplugin.so ./Test/benchmarks/Juliet_Test_Suite_v1.3_for_C_Cpp/C/testcases/CWE401_Memory_Leak/s01/
cd ./Test/benchmarks/Juliet_Test_Suite_v1.3_for_C_Cpp/C/testcases/CWE401_Memory_Leak/s01/
make
error detect
grep  "no free stmt possible memory leak" ./CWE401_Memory_Leak__char_calloc_*.o.log | uniq -c    | wc -l
grep  "no free stmt possible memory leak" ./CWE401_Memory_Leak__char_malloc*.o.log | uniq -c    | wc -l
grep  "no free stmt possible memory leak" ./CWE401_Memory_Leak__char_realloc*.o.log | uniq -c    | wc -l
grep  "no free stmt possible memory leak" ./CWE401_Memory_Leak__int_calloc*.o.log | uniq -c    | wc -l
grep  "no free stmt possible memory leak" ./CWE401_Memory_Leak__int_malloc*.o.log | uniq -c    | wc -l
grep  "no free stmt possible memory leak" ./CWE401_Memory_Leak__int_realloc*.o.log | uniq -c    | wc -l
grep  "no free stmt possible memory leak" ./CWE401_Memory_Leak__int64_t_calloc*.o.log | uniq -c    | wc -l
grep  "no free stmt possible memory leak" ./CWE401_Memory_Leak__int64_t_malloc*.o.log | uniq -c    | wc -l
grep  "no free stmt possible memory leak" ./CWE401_Memory_Leak__int64_t_realloc*.o.log | uniq -c    | wc -l
grep  "no free stmt possible memory leak" ./CWE401_Memory_Leak__malloc_realloc_char*.o.log | uniq -c    | wc -l
grep  "no free stmt possible memory leak" ./CWE401_Memory_Leak__malloc_realloc_int_*.o.log | uniq -c    | wc -l
grep  "no free stmt possible memory leak" ./CWE401_Memory_Leak__malloc_realloc_int64_t*.o.log | uniq -c    | wc -l
grep  "no free stmt possible memory leak" ./CWE401_Memory_Leak__malloc_realloc_struct_twoIntsStruct*.o.log | uniq -c    | wc -l
grep  "no free stmt possible memory leak" ./CWE401_Memory_Leak__malloc_realloc_twoIntsStruct*.o.log | uniq -c    | wc -l
double free
cp ./Compiler/newplugin.so ./Test/benchmarks/Juliet_Test_Suite_v1.3_for_C_Cpp/C/testcases/CWE415_Double_Free/s01/
cd ./Test/benchmarks/Juliet_Test_Suite_v1.3_for_C_Cpp/C/testcases/CWE415_Double_Free/s01/
make
error detect
grep  "possible double free" ./CWE415_Double_Free__malloc_free_char_*.o.log | uniq -c    | wc -l
grep  "possible double free" ./CWE415_Double_Free__malloc_free_int*.o.log | uniq -c    | wc -l
grep  "possible double free" ./CWE415_Double_Free__malloc_free_int64_t_*.o.log | uniq -c    | wc -l
grep  "possible double free" ./CWE415_Double_Free__malloc_free_long*.o.log | uniq -c    | wc -l
grep  "possible double free" ./CWE415_Double_Free__malloc_free_struct*.o.log | uniq -c    | wc -l
grep  "possible double free" ./CWE415_Double_Free__malloc_free_wchar_t*.o.log | uniq -c    | wc -l
use-after-free
cp ./Compiler/newplugin.so ./Test/benchmarks/Juliet_Test_Suite_v1.3_for_C_Cpp/C/testcases/CWE416_Use_After_Free/
cd ./Test/benchmarks/Juliet_Test_Suite_v1.3_for_C_Cpp/C/testcases/CWE416_Use_After_Free/
make
error detect
grep  "===== possiable asias =====" ./CWE416_Use_After_Free__malloc_free_char_*.o.log | uniq -c    | wc -l
grep  "===== possiable asias =====" ./CWE416_Use_After_Free__malloc_free_int_*.o.log | uniq -c    | wc -l
grep  "===== possiable asias =====" ./CWE416_Use_After_Free__malloc_free_int64_t_*.o.log | uniq -c | wc -l
grep  "===== possiable asias =====" ./CWE416_Use_After_Free__malloc_free_long_*.o.log | uniq -c    | wc -l
grep  "===== possiable asias =====" ./CWE416_Use_After_Free__malloc_free_struct_*.o.log | uniq -c    | wc -l
grep  "===== possiable asias =====" ./CWE416_Use_After_Free__return_freed_ptr_*.o.log | uniq -c    | wc -l
Detail detection
Test for each memory deallocation error.
cd Test
//memory leak
make unittestml
//double free
make unittestdf
//use-after-free
make unittestuaf
Support
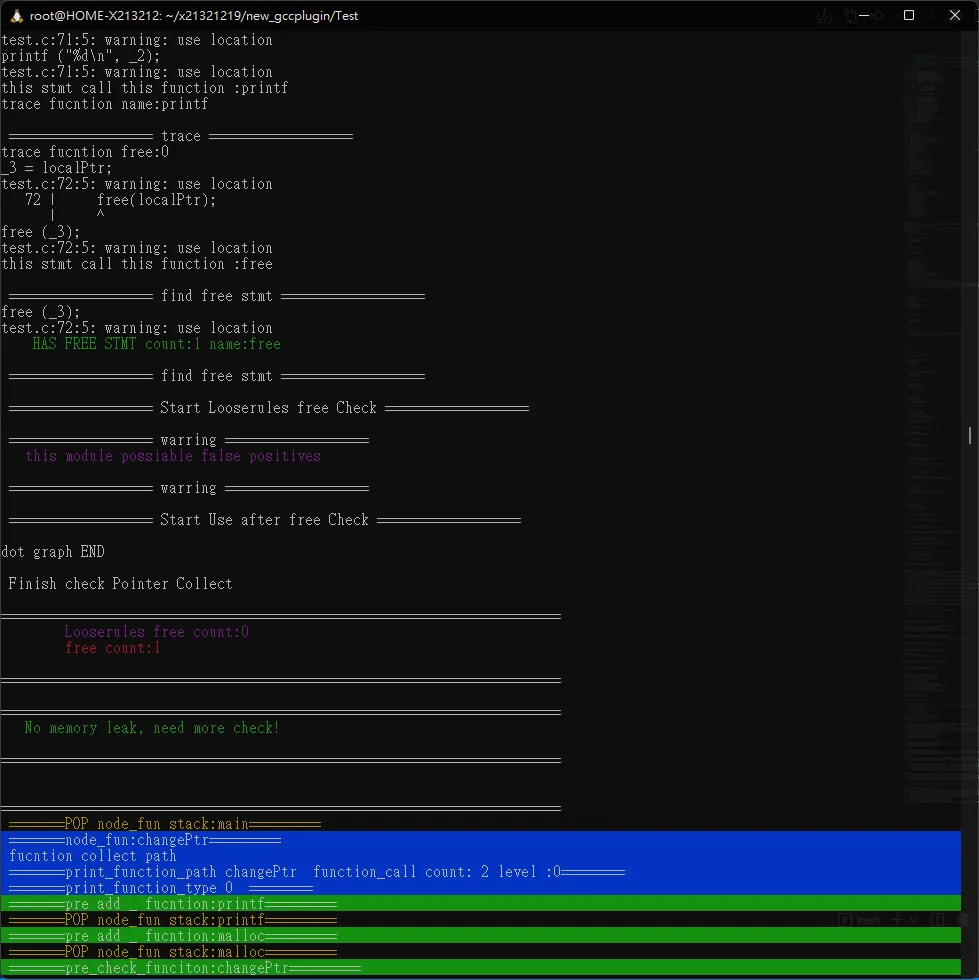
Console ascii color show!
Turn on or off the detection function
The content to be analyzed can be opened in the parser define. /Compiler/define.h
/*interprocedural analysis*/
bool ipa = true;
bool freeanysis = true; // no free no anysis
bool vscode_extensionmod = false;
bool vscode_extensionIgonefreemod = true;
bool defmemoryleak = true;
bool memoryleakcheck = true;
// Korea testcase need turn on
bool Looserulesfree = true;
bool useafterfree = false;
bool debugmod = false;
bool debugoutput = true;
bool threadmod = true;
bool relatemod = false;
bool freemod = true;
bool retmod = true;
bool pthread_detachedmod = false;
bool pthread_exitmod = false;
bool tracerelatestmt = true;
bool prebranchexit = false;
bool traceallfucntion =false;
bool retnotheapobjskipcheck=true;
bool stmtloopcheck = false;
bool samefucntioncheck = true;
bool maxbasicblockcalc = true;
bool pathconstraint = false;
bool contextsentive = true;
bool symbolicexecution = true;
Custome GCC PLUGIN flag
/Compiler/Algorithm.h/detect
    fprintf(stderr, "--------plugin argument-----------\n");
    for (int i = 0; i < argc; i++)
    {
        if (!strcmp(argv[i].key, "debugmod"))
            if (strtol(argv[i].value, NULL, 10)) // char* to int
                debugmod = true;
            else
                debugmod = false;
        if (!strcmp(argv[i].key, "vscode_extensionmod"))
            if (strtol(argv[i].value, NULL, 10)) // char* to int
                vscode_extensionmod = true;
            else
                vscode_extensionmod = false;

        fprintf(stderr, "%s %s\n", argv[i].key, argv[i].value);
    }
Use Custome GCC PLGUIN argument
/Test/Makefile
PLUGIN=-fplugin=../Compiler/newplugin.so -fplugin-arg-newplugin-debugmod=1 -fplugin-arg-newplugin-vscode_extensionmod=1
Use Custom GCC PLGUIN flag by Makefile
test.o:
ifeq ($(debug),0)
    $(eval PLUGIN=-fplugin=../Compiler/newplugin.so)
else ifeq ($(debug),1)
    $(eval PLUGIN=-fplugin=../Compiler/newplugin.so -fplugin-arg-newplugin-debugmod=0 -fplugin-arg-newplugin-vscode_extensionmod=1)
else ifeq ($(debug),2)
    $(eval PLUGIN=-fplugin=../Compiler/newplugin.so -fplugin-arg-newplugin-debugmod=1 -fplugin-arg-newplugin-vscode_extensionmod=1)
else ifeq ($(debug),3)
    $(eval PLUGIN=-fplugin=../Compiler/newplugin.so -fplugin-arg-newplugin-debugmod=1 -fplugin-arg-newplugin-vscode_extensionmod=0)
endif
Command
cd /Test/
make debug=0
make debug=1
make debug=2
make debug=3
Testing and analysis time
get file name
add grep -r   "algorithm time" ./  | cut -d " " -f 1
get algorithm time
add grep -r   "algorithm time" ./  | cut -d " " -f 7
Draw graphviz report
With graphviz it is currently possible to output analysis graphs for test data
cd Test
make gpz
It is important to note that Compile/Test/Makefile The following flags must be enabled
-fplugin-arg-newplugin-debugoutput=1
-fplugin-arg-newplugin-debugmod=1
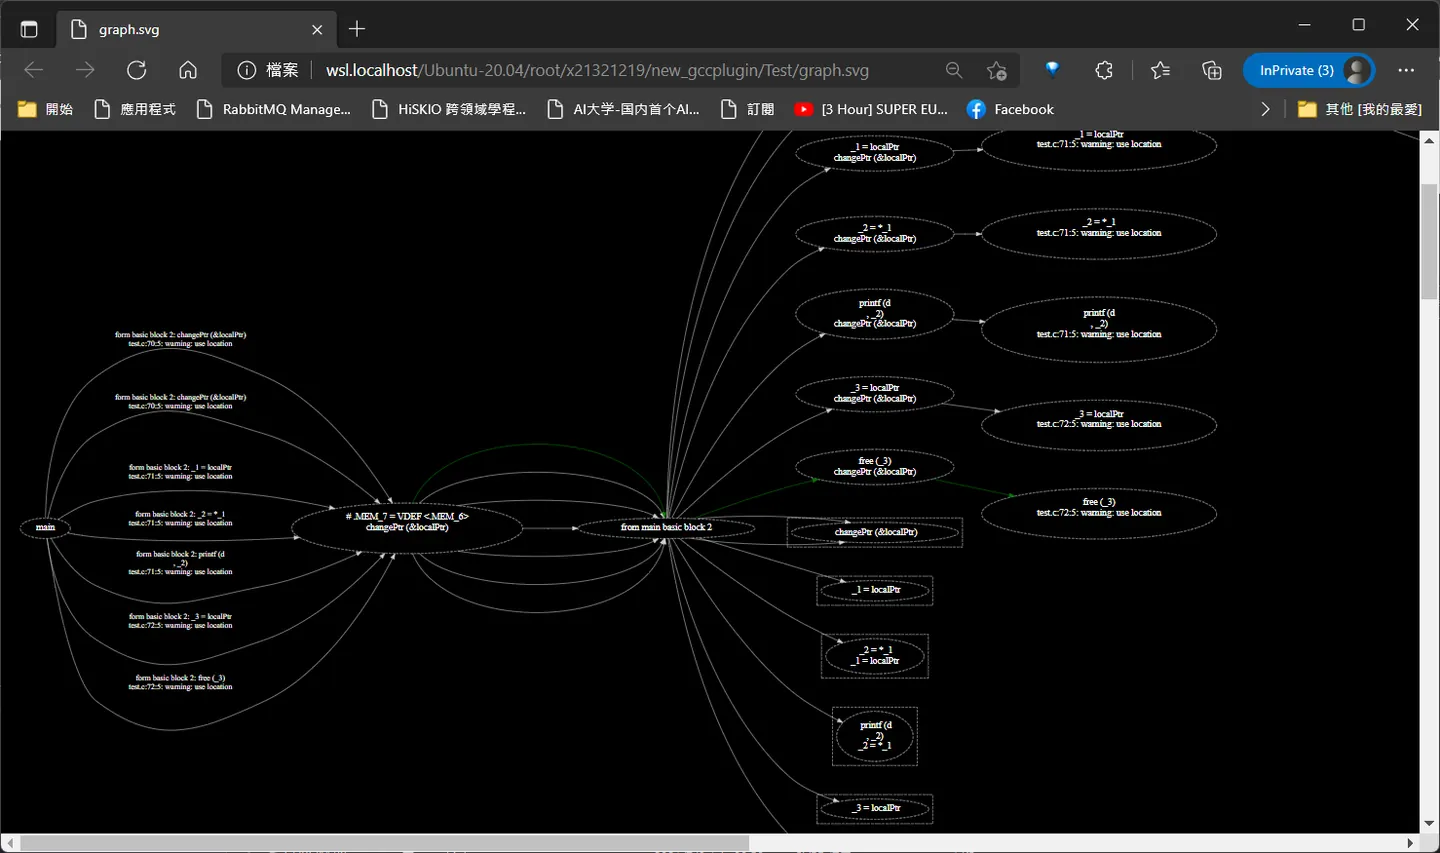
Use browser open ./graph.svg
Vscode Extension Support
Use filters to detect partial code fragments
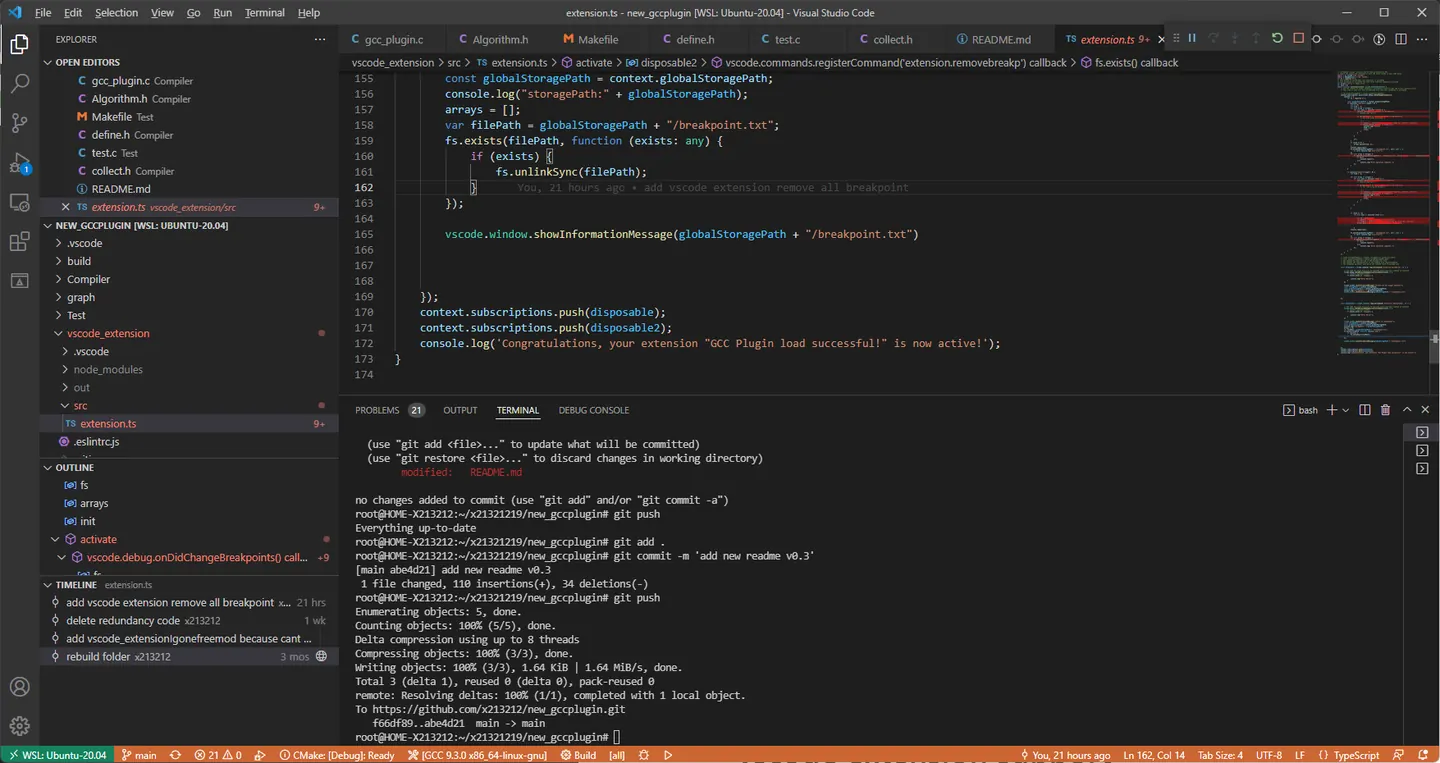 press f5 start debug extension
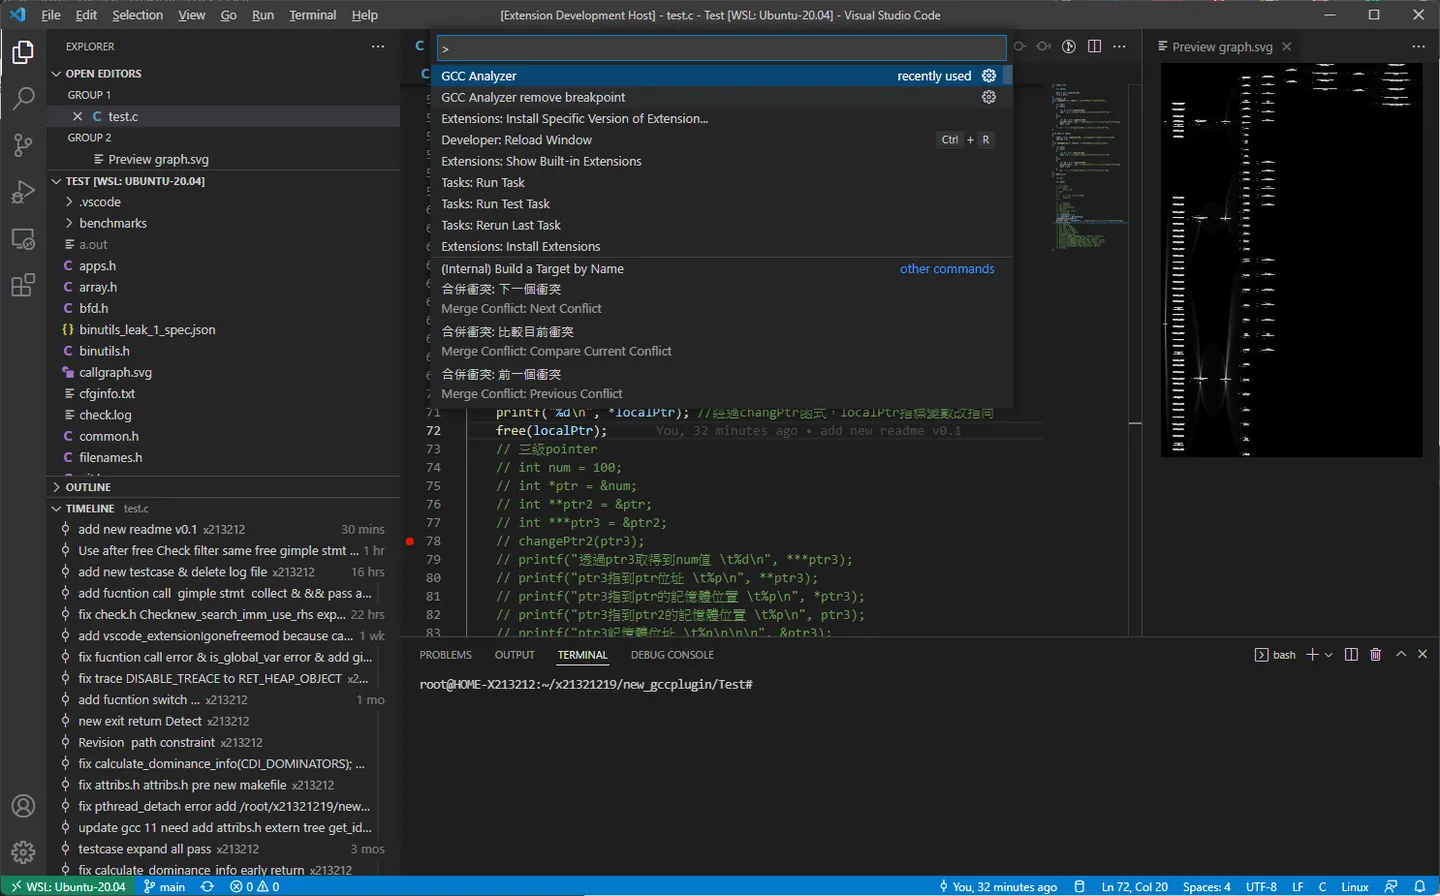
    "contributes": {
        "commands": [
            {
                "command": "extension.helloWorld",
                "title": "GCC Analyzer"
            },
            {
                "command": "extension.removebreakp",
                "title": "GCC Analyzer remove breakpoint"
            }
        ]
Compiler Vscode Extension
  vscode:prepublish
    npm run compile
  compile
    tsc -p ./
use ctrl+shift + p reload vscode extension
Breakpoint
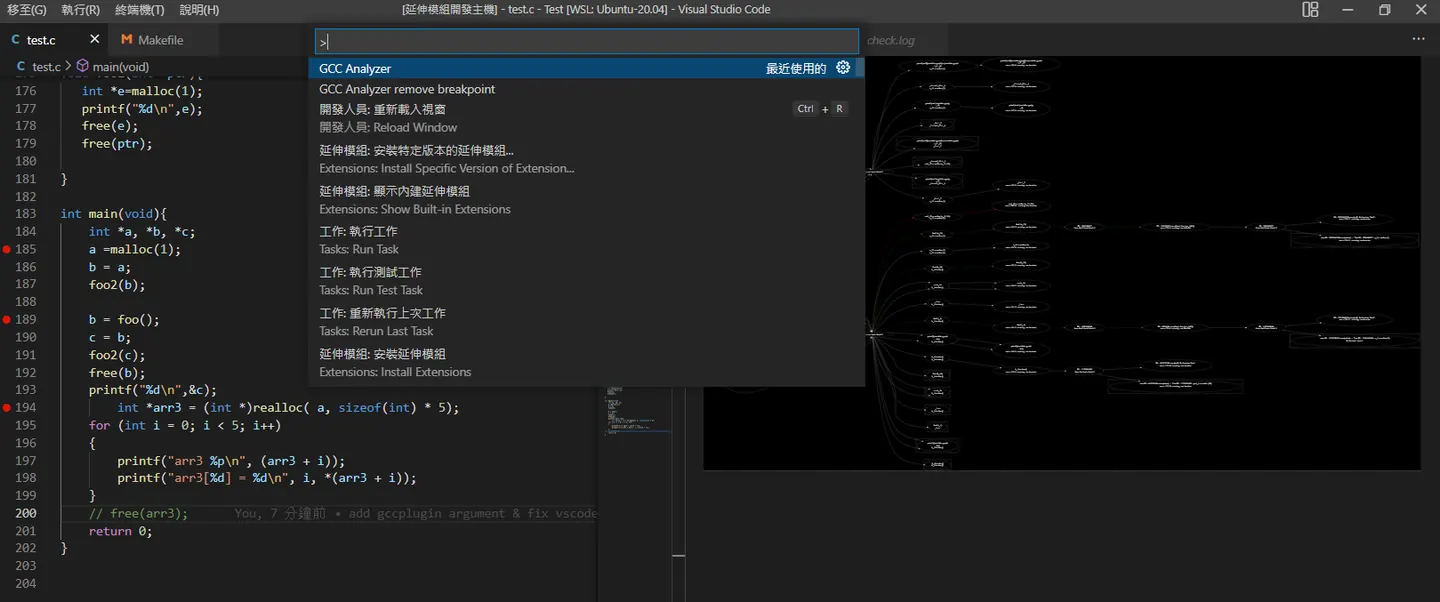 use ctrl+shift + p load GCC Analyzer
Select the starting point of the code where you want to set the breakpoint
use ctrl+shift + p load GCC Analyzer
Select the starting point of the code where you want to set the breakpoint
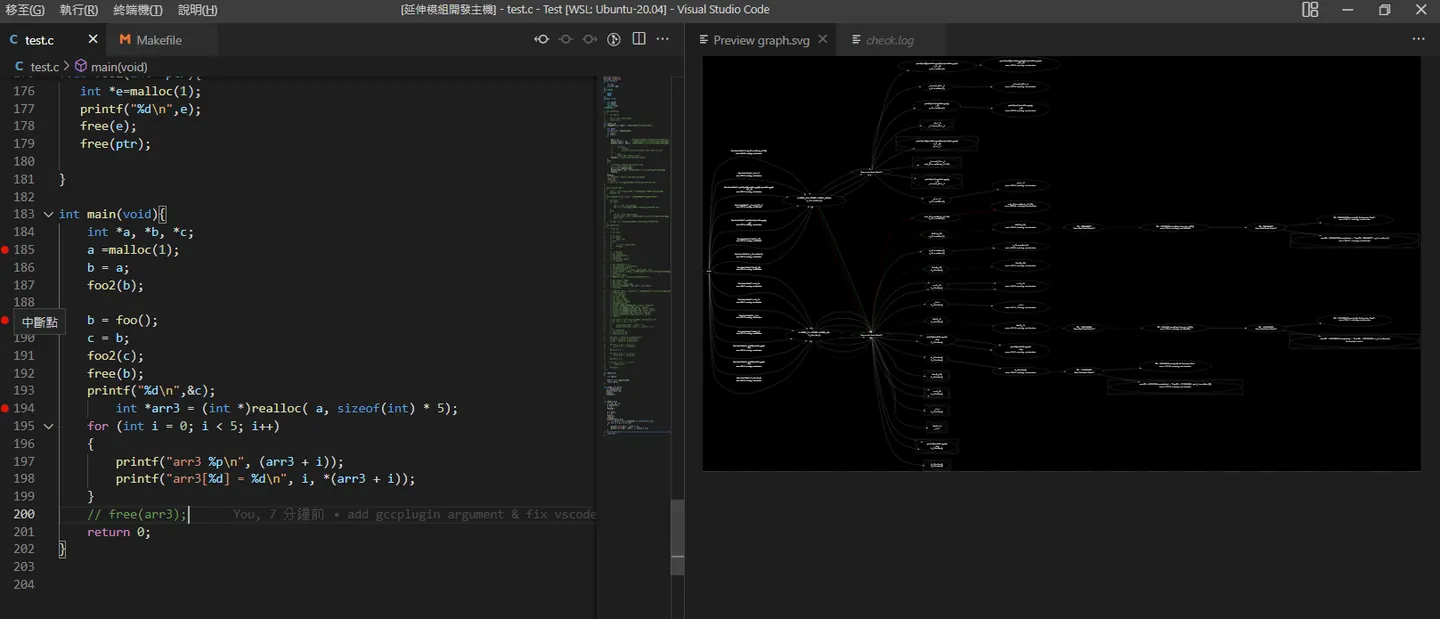
cd Test
make
The use of breakpoint does not vscode also does not matter. /Compiler/Algorithm.h
std::ifstream ifs("/root/.vscode-server/data/User/globalStorage/x213212.helloworld-sample/breakpoint.txt", std::ios::in);
The parser only reads the breakpoint.txt breakpoint data,But it must be set according to this rule.
//file name num <== According to the rules.

/root/x21321219/new_gccplugin/Compiler/new_imm_use.h 1409
This allows you to do filter in a lot of code.
Contributing
Feel free to dive in! Open an issue or submit PRs.
Standard Readme follows the Contributor Covenant Code of Conduct.
License
MIT license © x213212
Comments