
OpenManus or dify workflow
這邊很久沒更新ai相關,大概是年初的文章了,假設ai真實接入工作或者流程會是怎樣,這邊更新一下ai運用在日常會大概是長怎樣 這邊實際上接入用ai去分析,整個工作內容應該會變超廢的,基本上24小時都可以自動分析自動跑,人基本上去檢查報告就好。
運用 OpenManus 在優化策略環節使用ai去優化策略,或者直接進行交易
可能要將回測績效,抽成function 讓ai 可以運用工具進行分析,他核心是一種react 技術,應該可以拆出來 https://github.com/mannaandpoem/OpenManus https://zhuanlan.zhihu.com/p/30090038284
系統採用模組化架構,資料依序通過以下主要模組:
1. 資料取得 → 2. AI 分析 → 3. 策略判斷 → 4. 風控處理 → 5. 實驗記錄與回測分析 ->
6. 分析完再修改策略 再回到1.,重複跌代應該可以自動化分析
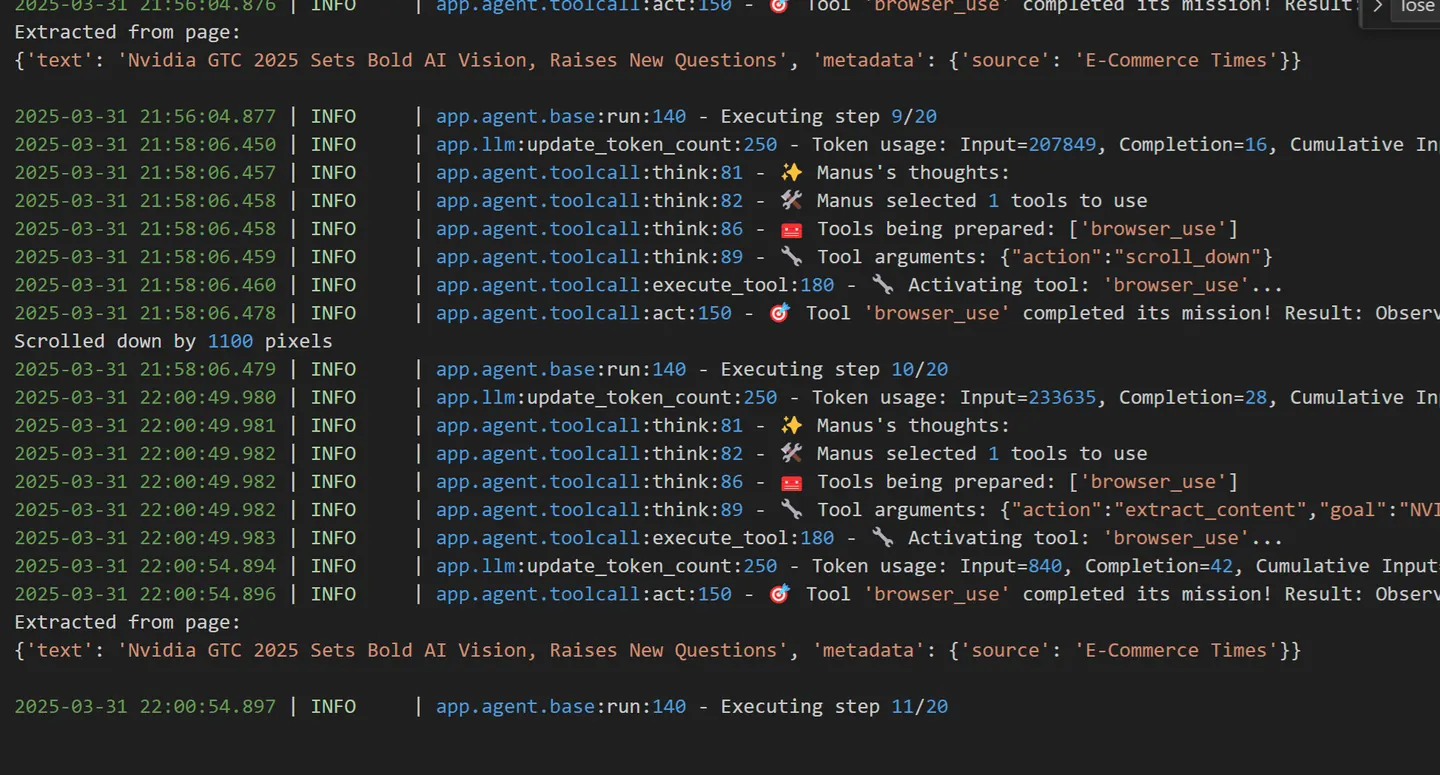
這邊有去使用 OpenManus 大概只要去實現 /root/bitcoing_data/OpenManus/app/tool 裡面就可以了 整個OpenManus 應該適用llm 去拆解任務細節與選用某個 tool 再決定下一步在做什麼。 整體用下來,很像在用 dify,也就是差別在,我已經知道整個流程是怎樣了在哪個環節用ai ,跟由ai 來決定下一個環節,假設gemini2 api 和 grok 3 api 有開放 deep serach 應該可以讓llm不斷的循環 疊帶演算法
/root/bitcoing_data/OpenManus/config/config.toml
可以設置api key
這邊只有運行看看實際效果
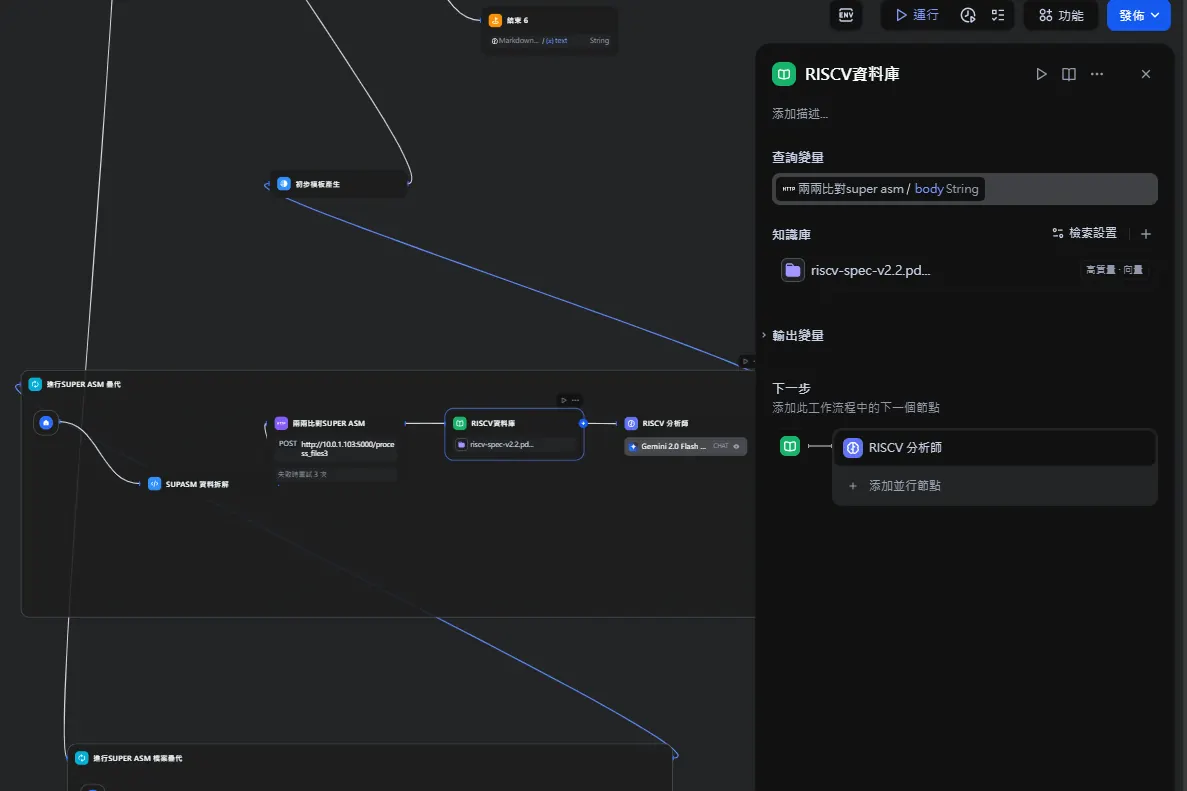
透過 aiagent 產生研究分析報告
在工作性質關係,我大部分時間都是在做自動化,近期主管讓我去研究怎麼透過 llm 進行分析組合語言,之前都是人工去看得要在那邊看spec,有問題的地方,這個弄好基本上就可以在餵入 bug 讓ai agent 自己找出最相應的資料透過 LLM 再進一步推理總結,目前只有做到這樣沒有繼續往內部研究。
 curl -X POST "http://10.0.12.188/v1/workflows/run"   --noproxy "10.0.12.188"   -H "Authorization: Bearer app-ANoJaG79QJV4NLKpW3U1rU3b"   -H "Content-Type: application/json"   -d '{"inputs":{"analysis_type":"靜態分析"},"response_mode":"streaming","user":"x213212","files":[]}'

 curl -X POST "http://10.0.12.188/v1/workflows/run"   --noproxy "10.0.12.188"   -H "Authorization: Bearer app-ANoJaG79QJV4NLKpW3U1rU3b"   -H "Content-Type: application/json"   -d '{"inputs":{"analysis_type":"動態分析"},"response_mode":"streaming","user":"x213212","files":[]}'

 curl -X POST "http://10.0.12.188/v1/workflows/run"   --noproxy "10.0.12.188"   -H "Authorization: Bearer app-ANoJaG79QJV4NLKpW3U1rU3b"   -H "Content-Type: application/json"   -d '{"inputs":{"analysis_type":"asm分析"},"response_mode":"streaming","user":"x213212","files":[]}'
通過api觸發
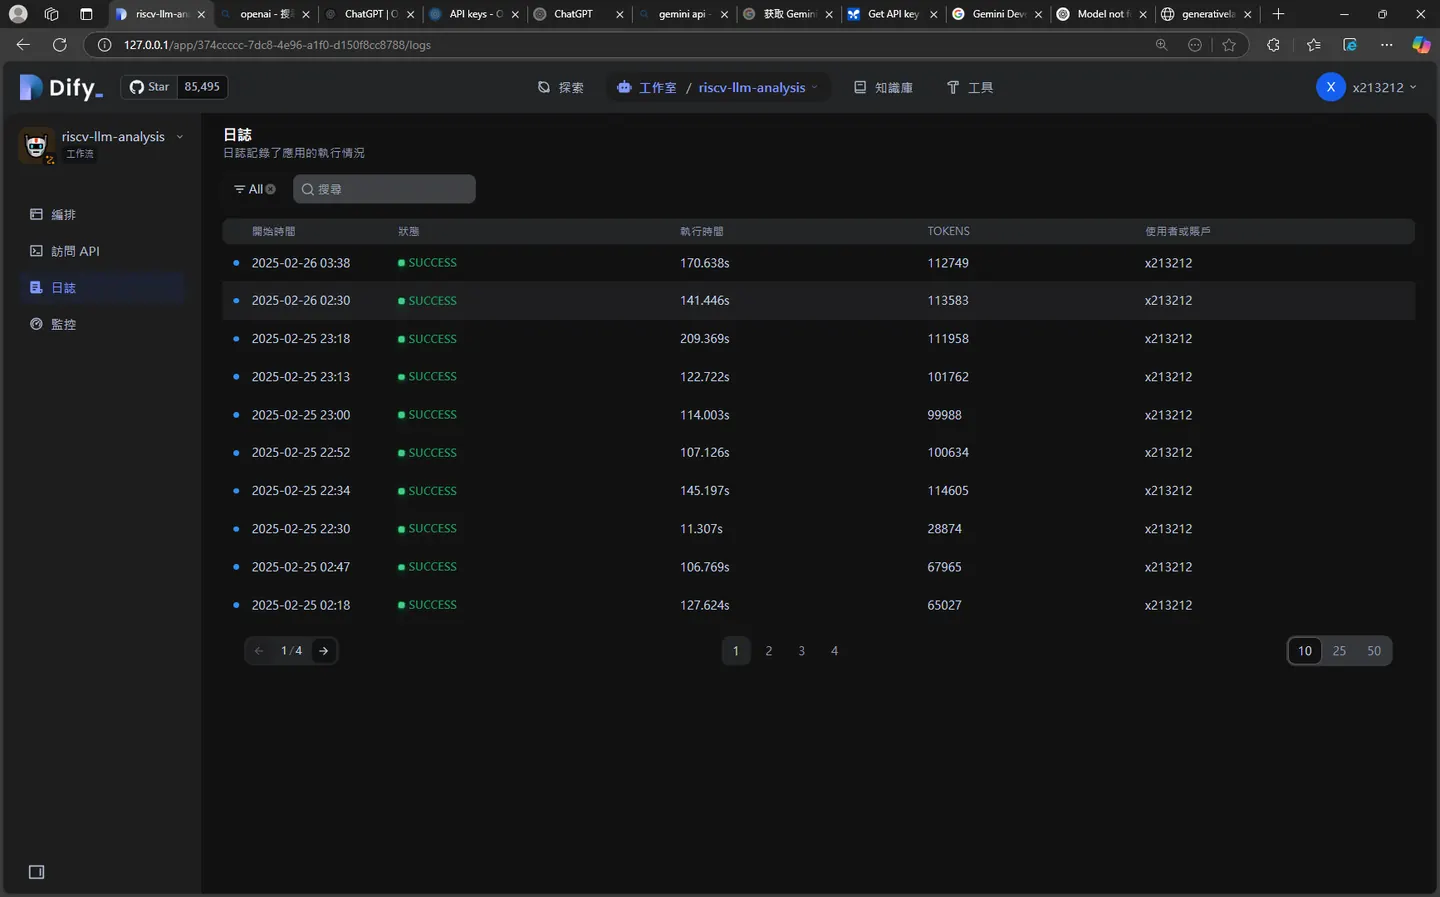
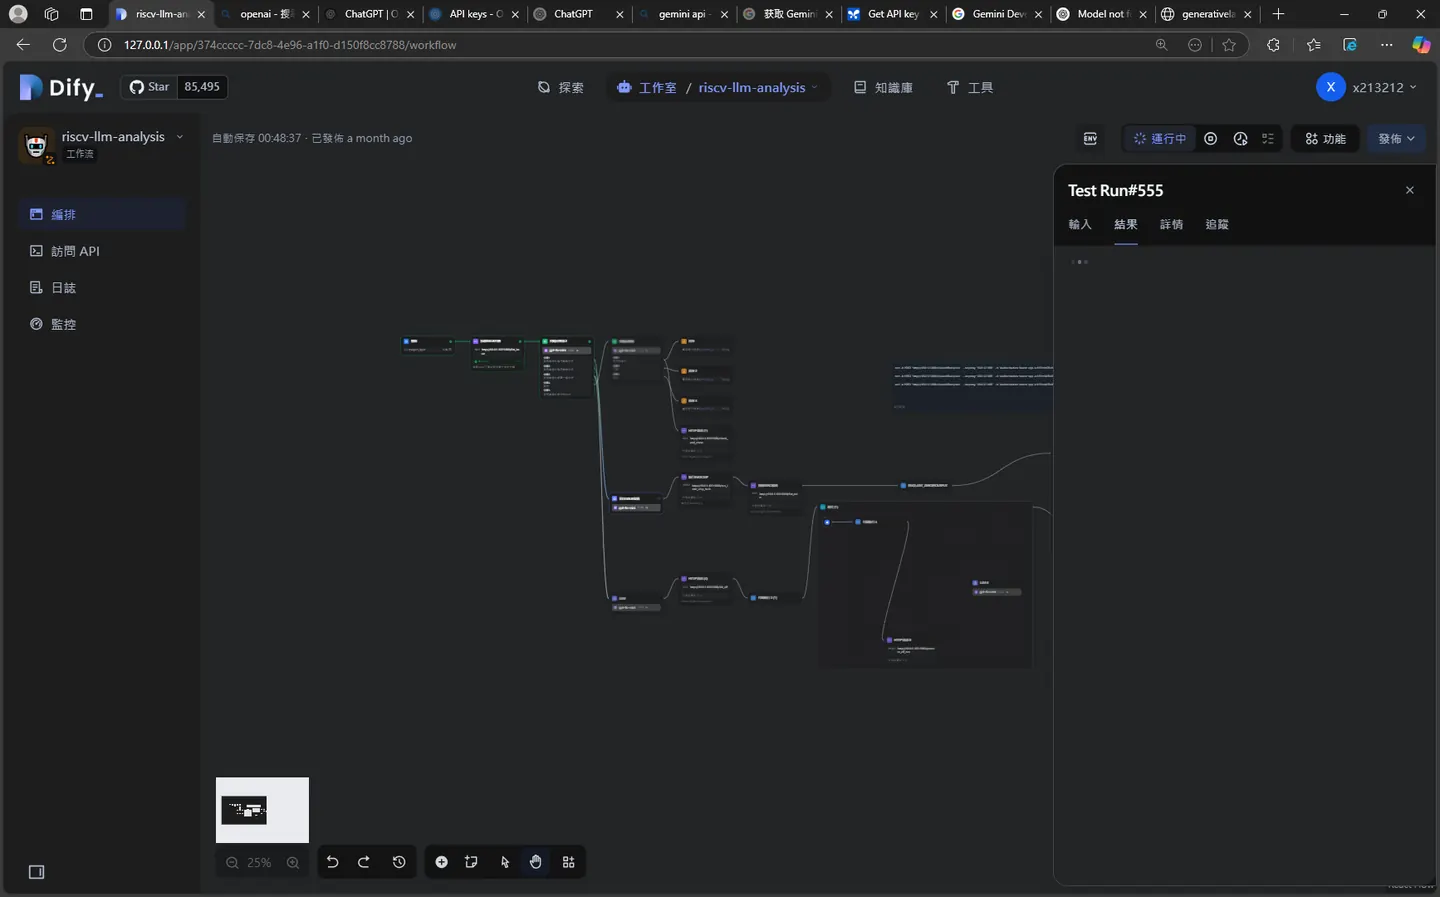
api呼叫紀錄
報告範例輸出
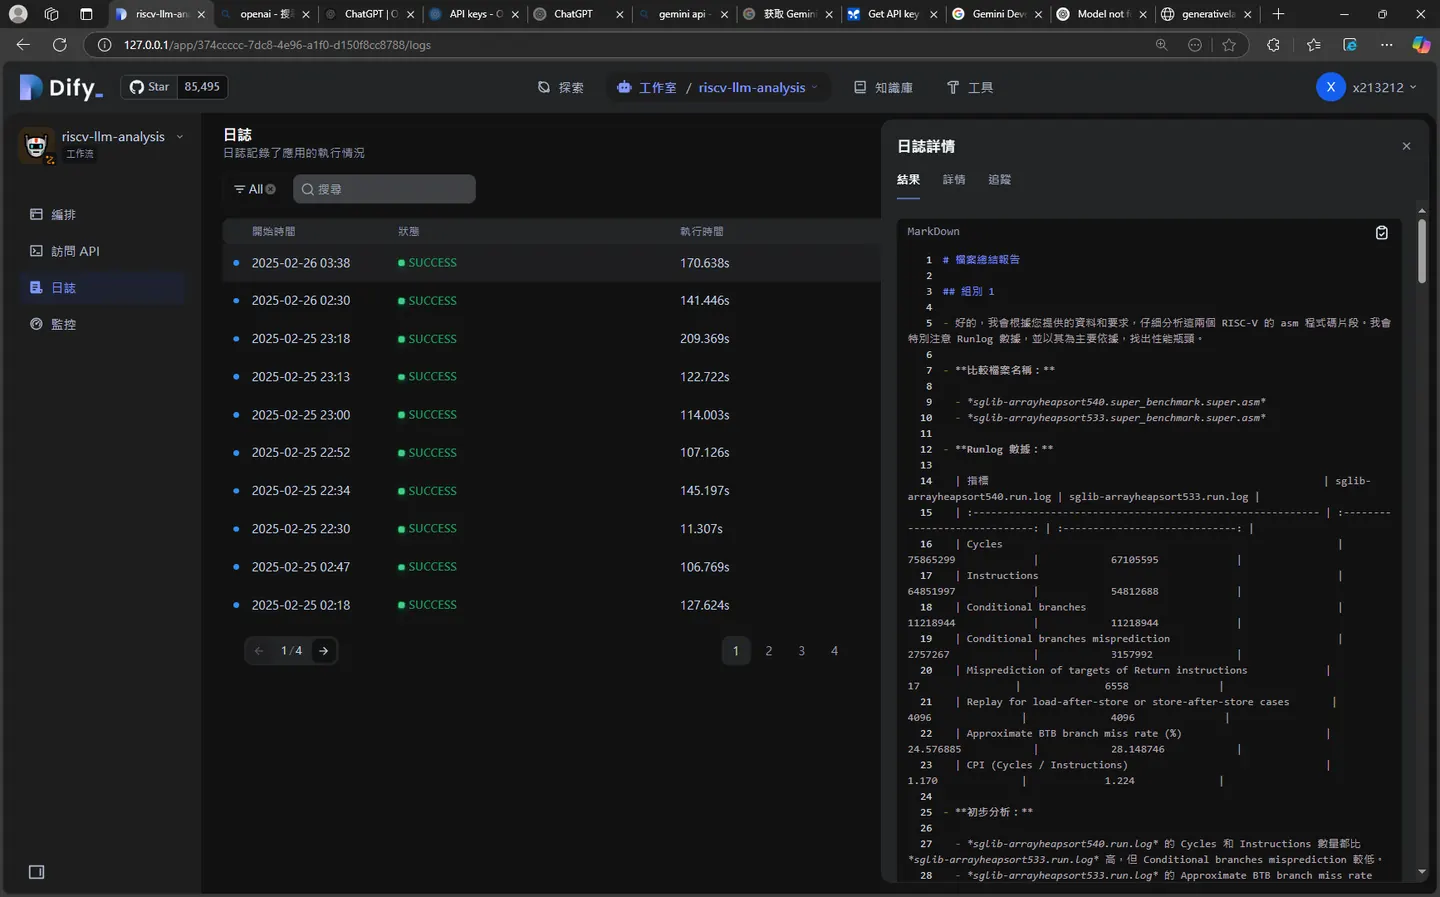
下面是透過 dify workflow 產生和 gemini 2 exp + chatgpt4o 產出來的報告。 一題大概一塊錢,目前gemini 2 exp 沒收費所以免費
組別 1
-
好的,我會根據您提供的資料和要求,仔細分析這兩個 RISC-V 的 asm 程式碼片段。我會特別注意 Runlog 數據,並以其為主要依據,找出性能瓶頸。
-
比較檔案名稱:
- sglib-arrayheapsort540.super_benchmark.super.asm
- sglib-arrayheapsort533.super_benchmark.super.asm
-
Runlog 數據:
| 指標 | sglib-arrayheapsort540.run.log | sglib-arrayheapsort533.run.log |
|---|---|---|
| Cycles | 75865299 | 67105595 |
| Instructions | 64851997 | 54812688 |
| Conditional branches | 11218944 | 11218944 |
| Conditional branches misprediction | 2757267 | 3157992 |
| Misprediction of targets of Return instructions | 17 | 6558 |
| Replay for load-after-store or store-after-store cases | 4096 | 4096 |
| Approximate BTB branch miss rate (%) | 24.576885 | 28.148746 |
| CPI (Cycles / Instructions) | 1.170 | 1.224 |
-
初步分析:
- sglib-arrayheapsort540.run.log 的 Cycles 和 Instructions 數量都比 sglib-arrayheapsort533.run.log 高,但 Conditional branches misprediction 較低。
- sglib-arrayheapsort533.run.log 的 Approximate BTB branch miss rate (%) 較高。
- sglib-arrayheapsort533.run.log 的 CPI 較高,表示平均每個指令需要更多 cycles。
-
根據 Runlog 數據,sglib-arrayheapsort540.run.log 雖然指令數較多,但 Cycles 較高,表示整體性能較差。因此,我會優先關注 sglib-arrayheapsort540.super_benchmark.super.asm 中指令數較多的地方,並分析其對性能的影響。
-
詳細比對與分析:
- 指令數差異最大的地方:
根據靜態分析報告,
benchmark函數中 AST540 的指令數從 295 增加到 336,總體指令數也從 434 增加到 472。這表示 sglib-arrayheapsort540.super_benchmark.super.asm 在benchmark函數中執行了更多指令。code - **PC Address 範圍:** - *sglib-arrayheapsort540.super_benchmark.super.asm*: 0x10c - 0x50c - *sglib-arrayheapsort533.super_benchmark.super.asm*: 0x11c - 0x4d4 - **關鍵指令差異:** - AST533 使用較多的 `add` 指令,而 AST540 使用較多的 `c.addiw`、`mv`、`c.mv`、`sext.w` 和 `c.nop` 指令。 - AST540 使用 `c.j` 指令更多,AST533 使用 `j` 指令更多。 - AST533 有 `ori` 指令,AST540 沒有。 - **分析:** - `c.addiw` 是壓縮指令,通常比 `addiw` 更短,但執行時間可能略長。 - `mv` 和 `c.mv` 指令用於移動暫存器值,可能用於優化資料傳輸。 - `sext.w` 指令用於符號擴展,可能用於處理不同大小的資料類型。 - `c.nop` 指令是空操作,可能用於填充指令 pipeline 或對齊程式碼。 - `c.j` 和 `j` 指令用於跳轉,`c.j` 是壓縮指令,可能用於縮小程式碼大小。 - `ori` 指令用於位元 OR 操作,可能被其他指令替代。 - **Runlog 驗證:** - *sglib-arrayheapsort540.run.log* 的 Instructions 數量較高,與靜態分析結果一致。 - *sglib-arrayheapsort533.run.log* 的 CPI 較高,可能與 `add` 指令的使用有關。-
迴圈分析:
- Function Inline: 雙方程式碼片段中沒有明顯的 function inline 差異。
-
Loop Unrolling: 雙方程式碼片段中沒有使用 loop unrolling。
- sglib-arrayheapsort540.super_benchmark.super.asm: 0x238 - 0x3dc
- sglib-arrayheapsort533.super_benchmark.super.asm: 0x248 - 0x3ba
-
迴圈行為差異:
- sglib-arrayheapsort540.super_benchmark.super.asm 在 0x238 - 0x3dc 範圍內,使用
c.addiw指令更新迴圈計數器,並使用beqz指令判斷迴圈是否結束。 - sglib-arrayheapsort533.super_benchmark.super.asm 在 0x248 - 0x3ba 範圍內,使用
addiw指令更新迴圈計數器,並使用beqz指令判斷迴圈是否結束。 - sglib-arrayheapsort540.super_benchmark.super.asm 在迴圈中使用了更多的壓縮指令,例如
c.mv、c.lw和c.sw。
- sglib-arrayheapsort540.super_benchmark.super.asm 在 0x238 - 0x3dc 範圍內,使用
-
分析:
- sglib-arrayheapsort540.super_benchmark.super.asm 使用更多的壓縮指令,可能導致程式碼大小更小,但執行時間可能略長。
- 雙方迴圈行為的細微差異可能影響性能,但需要更詳細的分析才能確定。
-
指令排序:
- 在 5 級 pipeline 下,sglib-arrayheapsort533.super_benchmark.super.asm 的指令排序可能略優於 sglib-arrayheapsort540.super_benchmark.super.asm。
- sglib-arrayheapsort540.super_benchmark.super.asm 中,
sext.w指令的使用可能導致 pipeline stall。- PC Address 範圍: 0x258, 0x272, 0x288, 0x368, 0x398, 0x408, 0x430, 0x498
-
Code Generation:
- sglib-arrayheapsort533.super_benchmark.super.asm 在某些情況下可能具有更好的 code generation。
- sglib-arrayheapsort540.super_benchmark.super.asm 中,
c.nop指令的使用可能表示 code generation 不夠優化。- PC Address 範圍: 0x23e, 0x286, 0x2ca, 0x30e, 0x352, 0x396, 0x42e, 0x476, 0x4be, 0x4e2
-
總結:
以下是影響性能導致下降的原因,根據嚴重性由上往下排:
1. **指令數量增加:** *sglib-arrayheapsort540.super_benchmark.super.asm* 在 `benchmark` 函數中執行了更多指令,導致 Instructions 數量增加,進而影響整體性能。
2. **分支預測錯誤率:** *sglib-arrayheapsort533.run.log* 的 Approximate BTB branch miss rate (%) 較高,表示分支預測錯誤率較高,導致 pipeline flush 和性能下降。
3. **CPI 較高:** *sglib-arrayheapsort533.run.log* 的 CPI 較高,表示平均每個指令需要更多 cycles,可能與 `add` 指令的使用有關。
4. **指令排序:** *sglib-arrayheapsort540.super_benchmark.super.asm* 中,`sext.w` 指令的使用可能導致 pipeline stall。
5. **Code Generation:** *sglib-arrayheapsort540.super_benchmark.super.asm* 中,`c.nop` 指令的使用可能表示 code generation 不夠優化。
-
結論:
- sglib-arrayheapsort540.run.log 的性能較差,主要原因是指令數量增加和指令排序不佳。
- sglib-arrayheapsort533.run.log 的分支預測錯誤率較高,也對性能產生負面影響。
- sglib-arrayheapsort540.super_benchmark.super.asm 中,
sext.w指令的使用可能導致 pipeline stall,c.nop指令的使用可能表示 code generation 不夠優化。 - sglib-arrayheapsort540.super_benchmark.super.asm 使用更多的壓縮指令,可能導致程式碼大小更小,但執行時間可能略長。
-
我已盡力根據您提供的資料和要求,仔細分析這兩個 RISC-V 的 asm 程式碼片段。如果您有任何其他問題,請隨時提出。
組別 2
-
好的,我會根據您提供的資料和要求,進行詳細的效能分析。
-
比較檔案名稱:
- sglib-arrayheapsort533.run.log
- sglib-arrayheapsort540.run.log
-
Runlog 數據表格:
| 指標 | sglib-arrayheapsort533.run.log | sglib-arrayheapsort540.run.log |
|---|---|---|
| Cycles | 67105595 | 75865299 |
| Instructions | 54812688 | 64851997 |
| Conditional branches | 11218944 | 11218944 |
| Conditional branches misprediction | 3157992 | 2757267 |
| Misprediction of targets of Return instructions | 6558 | 17 |
| Replay for load-after-store or store-after-store cases | 4096 | 4096 |
| Approximate BTB branch miss rate (%) | 28.148746 | 24.576885 |
| CPI (Cycles / Instructions) | 1.224 | 1.170 |
- 初步分析:
從 Runlog 數據來看,sglib-arrayheapsort540.run.log 的 Cycles 和 Instructions 數量都明顯高於 sglib-arrayheapsort533.run.log,但 CPI 較低,BTB branch miss rate 也較低。這表示 sglib-arrayheapsort540.run.log 執行了更多指令,但每個指令平均花費的 Cycles 較少,分支預測的準確度也較高。Misprediction of targets of Return instructions 差異非常大,這點值得注意。
接下來,我會根據您提供的 asm 片段和靜態分析報告,找出導致這些差異的具體原因。
- 詳細分析:
首先,根據靜態分析報告,benchmark 函式和總體指令數差異最大,因此我會優先關注這些區域。
1. main 函式比較 (PC Address 0xc0 - 0x106):
- **指令數量差異:** *sglib-arrayheapsort533.super_main.super.asm* 在迴圈中有 `addiw` 指令,而 *sglib-arrayheapsort540.super_main.super.asm* 使用 `c.addiw`。*sglib-arrayheapsort533.super_main.super.asm* 還有 `c.mv` 指令,*sglib-arrayheapsort540.super_main.super.asm* 沒有。
- **迴圈行為:** *sglib-arrayheapsort533.super_main.super.asm* 的迴圈從 `0xdc` 開始,*sglib-arrayheapsort540.super_main.super.asm* 的迴圈從 `0xd4` 開始。*sglib-arrayheapsort540.super_main.super.asm* 使用了壓縮指令 `c.bnez`,這可能略微提高了程式碼密度。
- **疑似問題:** *sglib-arrayheapsort533.super_main.super.asm* 在迴圈中使用了 `addiw` 和 `c.mv`,這兩個指令在 *sglib-arrayheapsort540.super_main.super.asm* 中被移除或替換,可能導致指令數量增加。

  **2. 迴圈展開 (Loop Unrolling) 分析:**

- 從提供的 asm 片段來看,沒有明顯的迴圈展開 (Loop Unrolling) 跡象。

  **3. 指令排序:**

- 由於沒有提供足夠的 asm 程式碼,難以判斷具體的指令排序優劣。但從壓縮指令的使用情況來看,*sglib-arrayheapsort540.super_main.super.asm* 可能在程式碼密度上略有優勢。

  **4. Code Generation:**

- *sglib-arrayheapsort540.super_main.super.asm* 使用了更多的壓縮指令,例如 `c.addiw` 和 `c.bnez`,這可能表明在程式碼密度方面有更好的 code generation。

  **5. 函式內聯 (Inline Function) 判斷:**

- 從提供的 asm 片段來看,沒有明顯的函式內聯差異。
- 總結:
根據上述分析和 Runlog 數據,以下是影響性能的主要因素,按嚴重性從上往下排列:
1. **指令數量增加:** *sglib-arrayheapsort540.run.log* 的 Instructions 數量明顯高於 *sglib-arrayheapsort533.run.log*,這直接導致 Cycles 增加。靜態分析顯示,`benchmark` 函數和總體指令數差異最大,可能是指令增加的主要來源。
2. **Conditional branches misprediction 降低:** *sglib-arrayheapsort540.run.log* 的 Conditional branches misprediction 數量低於 *sglib-arrayheapsort533.run.log*,這有助於減少 Cycles。
3. **Misprediction of targets of Return instructions 降低:** *sglib-arrayheapsort540.run.log* 的 Misprediction of targets of Return instructions 數量遠低於 *sglib-arrayheapsort533.run.log,這有助於減少 Cycles。
4. **BTB branch miss rate 降低:** *sglib-arrayheapsort540.run.log* 的 Approximate BTB branch miss rate (%) 低於 *sglib-arrayheapsort533.run.log*,這也有助於減少 Cycles。
5. **壓縮指令的使用:** *sglib-arrayheapsort540.super_main.super.asm* 使用了更多的壓縮指令,例如 `c.addiw` 和 `c.bnez`,這可能略微提高了程式碼密度,但對整體性能的影響可能較小。
-
結論:
- sglib-arrayheapsort540.run.log 的 Cycles 增加主要是由於 Instructions 數量增加。
- sglib-arrayheapsort540.run.log 的 CPI 較低,BTB branch miss rate 也較低,這表明其指令排序和分支預測可能略有優勢。
- 靜態分析顯示,
benchmark函數和總體指令數差異最大,可能是指令增加的主要來源。 - sglib-arrayheapsort540.super_main.super.asm 使用了更多的壓縮指令,可能在程式碼密度方面有更好的 code generation。
- Misprediction of targets of Return instructions 差異非常大,這點值得注意。
-
我已盡力根據您提供的資料進行詳細分析,並確保結果沒有顛倒。如果需要更深入的分析,請提供更多的 asm 程式碼。
組別 3
-
好的,我會盡力按照您的要求,仔細分析提供的資料,並以清晰、簡潔的方式呈現結果。
-
比較檔案名稱:
- sglib-arrayheapsort533.super.asm
- sglib-arrayheapsort540.super.asm
-
Runlog 數據:
| 指標 | sglib-arrayheapsort533.run.log | sglib-arrayheapsort540.run.log |
|---|---|---|
| Cycles | 67105595 | 75865299 |
| Instructions | 54812688 | 64851997 |
| Conditional branches | 11218944 | 11218944 |
| Conditional branches misprediction | 3157992 | 2757267 |
| Misprediction of targets of Return instructions | 6558 | 17 |
| Replay for load-after-store or store-after-store cases | 4096 | 4096 |
| Approximate BTB branch miss rate (%) | 28.148746 | 24.576885 |
- 初步分析:
從 Runlog 數據來看,sglib-arrayheapsort540.run.log 的 Cycles 和 Instructions 數量都明顯高於 sglib-arrayheapsort533.run.log,但 Conditional branches misprediction 較低。這表示 sglib-arrayheapsort540.super.asm 執行了更多的指令,導致更高的 Cycles 數,但分支預測的準確性有所提升。
根據靜態分析報告,benchmark 函式的指令差異最大,因此我將重點分析這部分。
1. Function Inline 判斷
- sglib-arrayheapsort533.super.asm:
- 在
_start函式 (PC Address0x64) 呼叫memset函式 (PC Address0x474000ef)。
- 在
- sglib-arrayheapsort540.super.asm:
- 在
_start函式 (PC Address0x62) 呼叫memset函式 (PC Address0x4ae000ef)。
- 在
結論: 雙方都有呼叫 memset 函式,沒有 inline 差異。
2. Loop Unrolling 分析
在提供的 asm 片段中,沒有明顯的 loop unrolling 跡象。benchmark 函式中的迴圈 (PC Address 0x248 ~ 0x3bc in sglib-arrayheapsort533.super.asm, PC Address 0x238 ~ 0x3dc in sglib-arrayheapsort540.super.asm) 看起來都是標準的迴圈結構。
3. 指令排序
由於沒有提供足夠的程式碼片段,難以進行全面的指令排序分析。但可以針對 benchmark 函式中的迴圈進行初步分析。
4. Code Generation 與其他疑似問題
- **`_start` 函數 (PC Address `0x5e` ~ `0x64`):**
  - **sglib-arrayheapsort533.super.asm:**
    ```assembly
    5e: 8e09      c.sub      a2,a0
    60: 00000593  li         a1,0
    64: 474000ef  jal        0x4d8 <memset>
  - **sglib-arrayheapsort540.super.asm:**
    ```assembly
    5e: 8e09      c.sub      a2,a0
    60: 4581      c.li       a1,0
    62: 4ae000ef  jal        0x510 <memset>
  - **差異:** *sglib-arrayheapsort540.super.asm* 使用 `c.li` 指令,而 *sglib-arrayheapsort533.super.asm* 使用 `li` 指令。`c.li` 是壓縮指令,通常執行速度更快。
- **`main` 函數 (PC Address `0xd4` ~ `0xe0`):**
  - **sglib-arrayheapsort533.super.asm:**
    ```assembly
    d4: 6505      c.lui      a0,0x1
    d6: 4581      c.li       a1,0
    d8: fff5041b  addiw      s0,a0,-1 # 0xfff <ILM_SIZE+0xa87>
    dc: 84ae      c.mv       s1,a1
    ec: fe84e8e3  bltu       s1,s0,0xdc <main+0x1c>
  - **sglib-arrayheapsort540.super.asm:**
    ```assembly
    d2: 6405      c.lui      s0,0x1
    d4: 034000ef  jal        0x108 <initialise_benchmark>
    d8: 034000ef  jal        0x10c <benchmark>
    dc: 347d      c.addiw    s0,-1 # 0xfff <ILM_SIZE+0xa4f>
    e0: f875      c.bnez     s0,0xd4 <main+0x14>
- 差異: sglib-arrayheapsort540.super.asm 在迴圈中呼叫了
initialise_benchmark和benchmark函式,這會導致額外的函式呼叫開銷,增加 Cycles 和 Instructions 數量。 benchmark函式 (迴圈內部):- sglib-arrayheapsort533.super.asm: 使用
nds.lea.w指令計算地址。 - sglib-arrayheapsort540.super.asm: 使用
nds.lea.w指令計算地址,但穿插了更多的sext.w指令。 - 疑似問題:
sext.w指令的增加可能與資料類型處理有關,但具體原因需要更詳細的程式碼分析。
- sglib-arrayheapsort533.super.asm: 使用
5. 迴圈行為
benchmark 函式中的迴圈行為大致相同,都是在一定條件下重複執行一段程式碼。但 sglib-arrayheapsort540.super.asm 在迴圈中呼叫了 initialise_benchmark 和 benchmark 函式,這會導致額外的函式呼叫開銷。
6. 指令比較
- **`benchmark` 函數 (PC Address `0x240` ~ `0x2cc`):**
  - **sglib-arrayheapsort533.super.asm:**
    ```assembly
    248: ffd8889b  addiw      a7,a7,-3
    24c: 16080863  beqz       a6,0x3bc <DLM_SIZE+0x94>
    250: 0018961b  slliw      a2,a7,0x1
    254: 00166593  ori        a1,a2,1
    258: 06b2ea63  bltu       t0,a1,0x2cc <DATA_SIZE+0x13c>
    ...
    2c8: fa65c0e3  blt        a1,t1,0x268 <DATA_SIZE+0xd8>
  - **sglib-arrayheapsort540.super.asm:**
    ```assembly
    238: 3875      c.addiw    a6,-3
    23a: 1a088163  beqz       a7,0x3dc <DLM_SIZE+0xb4>
    23e: 0001      c.nop
    240: 0018159b  slliw      a1,a6,0x1
    244: 00158793  addi       a5,a1,1
    248: 08f2e263  bltu       t0,a5,0x2cc <DATA_SIZE+0x13c>
    ...
    2c6: f867c9e3  blt        a5,t1,0x258 <DATA_SIZE+0xc8>
- 差異: sglib-arrayheapsort540.super.asm 在迴圈開始處多了一個
c.nop指令 (PC Address0x23e),並使用addi指令代替ori指令。此外,sglib-arrayheapsort540.super.asm 使用a5暫存器代替a1暫存器進行比較。
總結:
以下是影響性能導致下降的原因,根據嚴重性由上往下排:
- 迴圈內額外的函式呼叫 (sglib-arrayheapsort540.super.asm): 在
main函式的迴圈中 (PC Address0xd4~0xe0),sglib-arrayheapsort540.super.asm 呼叫了initialise_benchmark和benchmark函式,這會導致額外的函式呼叫開銷,增加 Cycles 和 Instructions 數量。 benchmark函式中指令數增加 (sglib-arrayheapsort540.super.asm): 在benchmark函式中,sglib-arrayheapsort540.super.asm 穿插了更多的sext.w指令,這可能與資料類型處理有關,但具體原因需要更詳細的程式碼分析。- 迴圈開始處多餘的
c.nop指令 (sglib-arrayheapsort540.super.asm): 在benchmark函式的迴圈開始處 (PC Address0x23e),sglib-arrayheapsort540.super.asm 多了一個c.nop指令,這會增加指令數量。
結論:
- sglib-arrayheapsort540.super.asm 的 Cycles 和 Instructions 數量都明顯高於 sglib-arrayheapsort533.super.asm,主要是因為在
main函式的迴圈中呼叫了initialise_benchmark和benchmark函式,以及在benchmark函式中指令數增加。 - sglib-arrayheapsort540.super.asm 的 Conditional branches misprediction 較低,可能是因為程式碼結構的調整,但具體原因需要更詳細的程式碼分析。
- sglib-arrayheapsort540.super.asm 在
_start函式中使用c.li指令代替li指令,這是一個優化。
請注意,以上分析是基於提供的資料,更精確的分析需要更詳細的程式碼和硬體架構資訊。
上述是我最近在整合的部分。
透過 rag解決資料幻覺的部分
 這邊只要持續增加相關資料就可以讓ai agent 幻覺依照我們的經驗去推理。
Comments