
反指標可行性?
---
如何用Google Trends找到「逃命訊號」?打一個關鍵字,就找出股價高點的方法
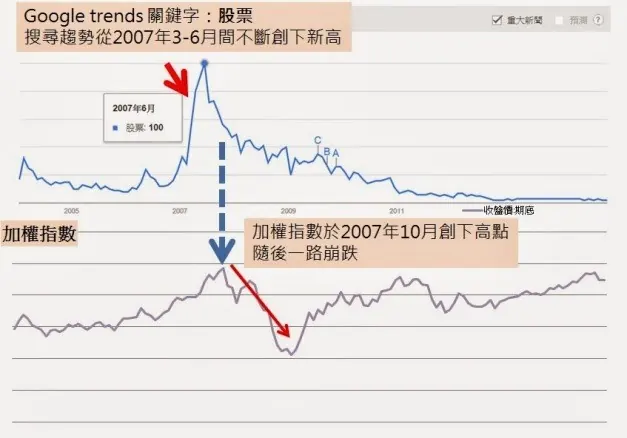
從線圖可以看到,在Google上搜尋「股票」的人,在2007年3月開始異常增加,並在6月達到高峰,在此之後搜尋程度都一直相較過去維持在高檔,股市則於2007年10月後開始下跌。
「你覺得,什麼人會在Google上搜尋『股票』這種無關緊要的關鍵字?」我問,
「只有剛入門的散戶有可能吧...」他已經懂了,並用詭譎的笑容看著這張圖。
那如何取得資料到python?
---
pytrends 裝好後,我們切換到程式碼面,我們要一次爬一年,我遇到了一個問題怎麼爬著爬著到2014年資料都是空的,
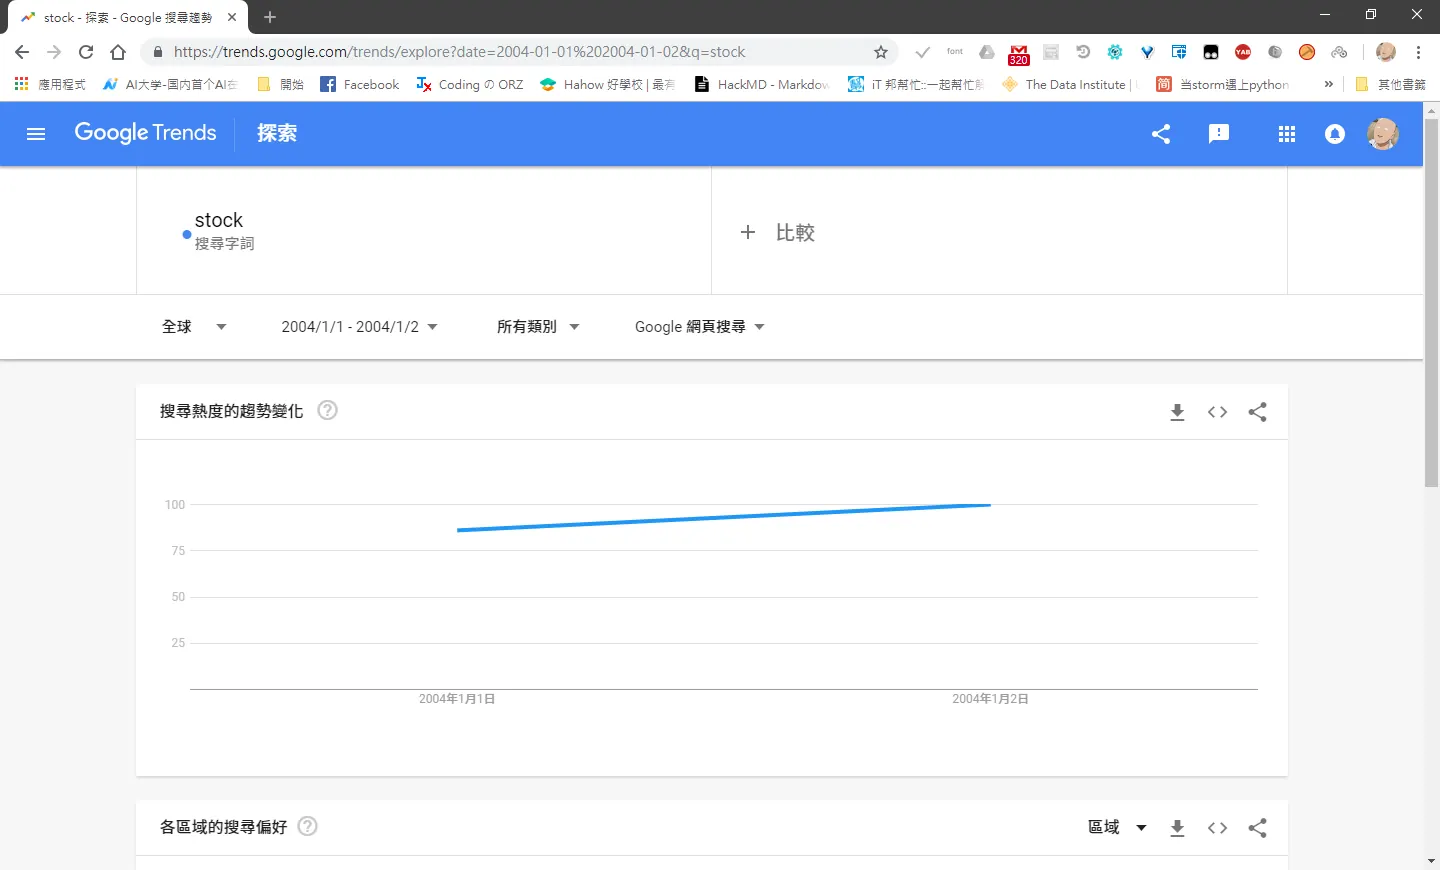 奇怪有資料阿,切去看程式碼面
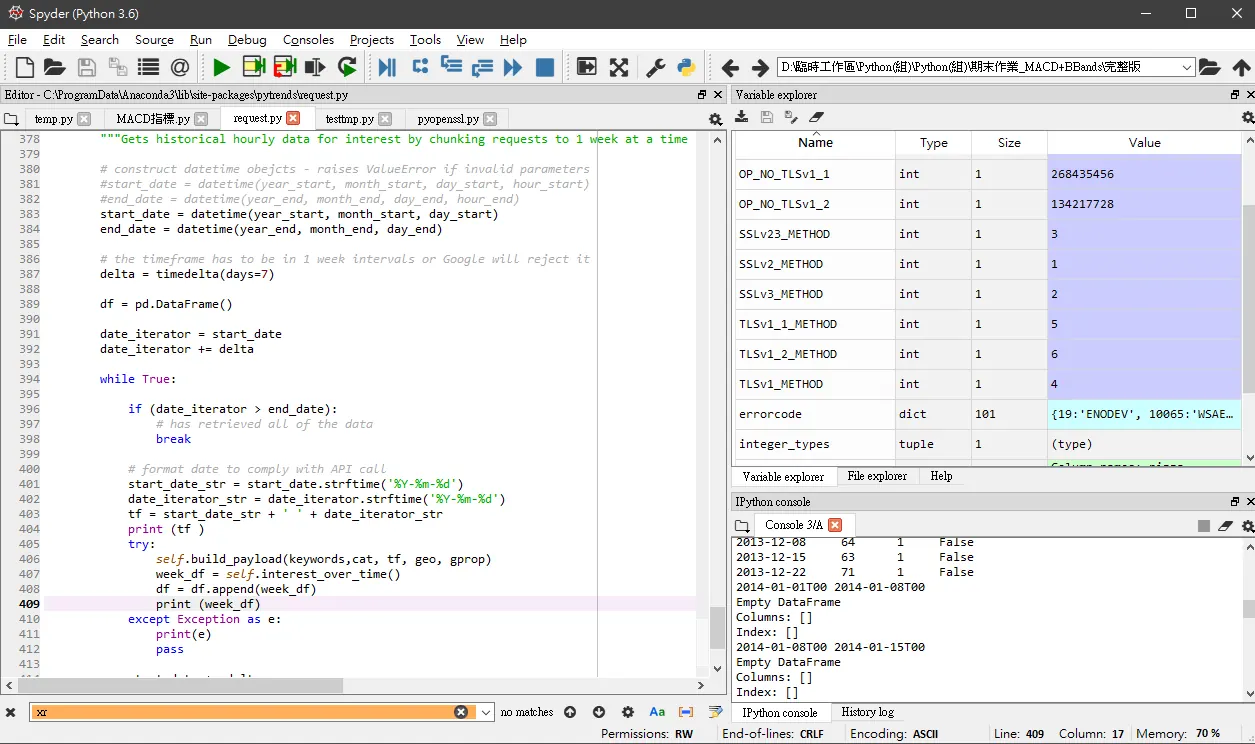 觀察一下網址
https://trends.google.com/trends/explore?date=2004-01-01%202004-01-02&q=stock
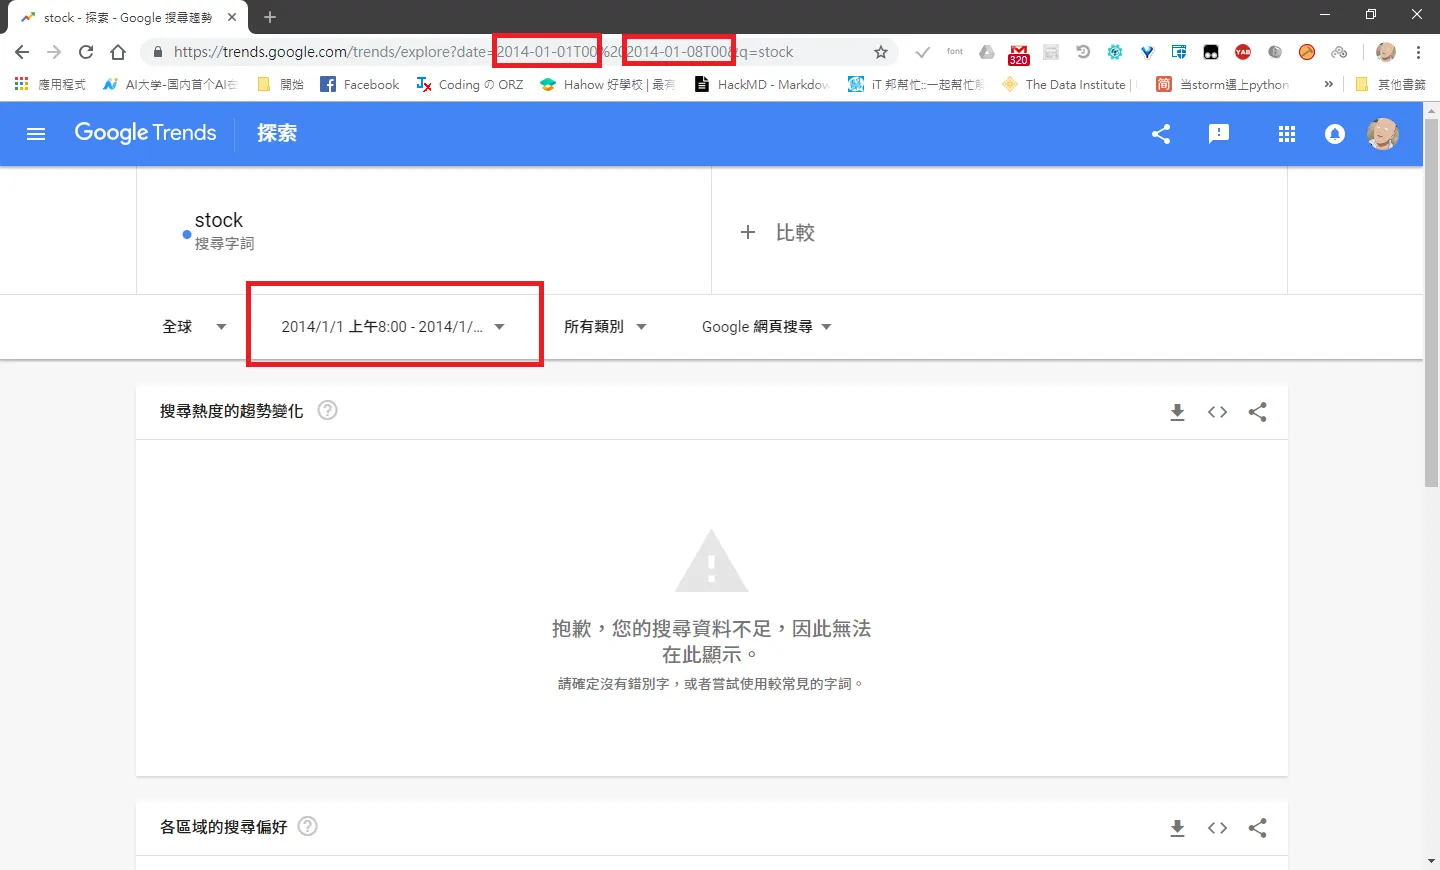 得到結論,在2015年前,都只有儲存當日資料,到2015開始可能才有每小時搜尋資料紀錄。
那麼接下來就可以爬2004年到2018年資料。
驗證成功,開爬
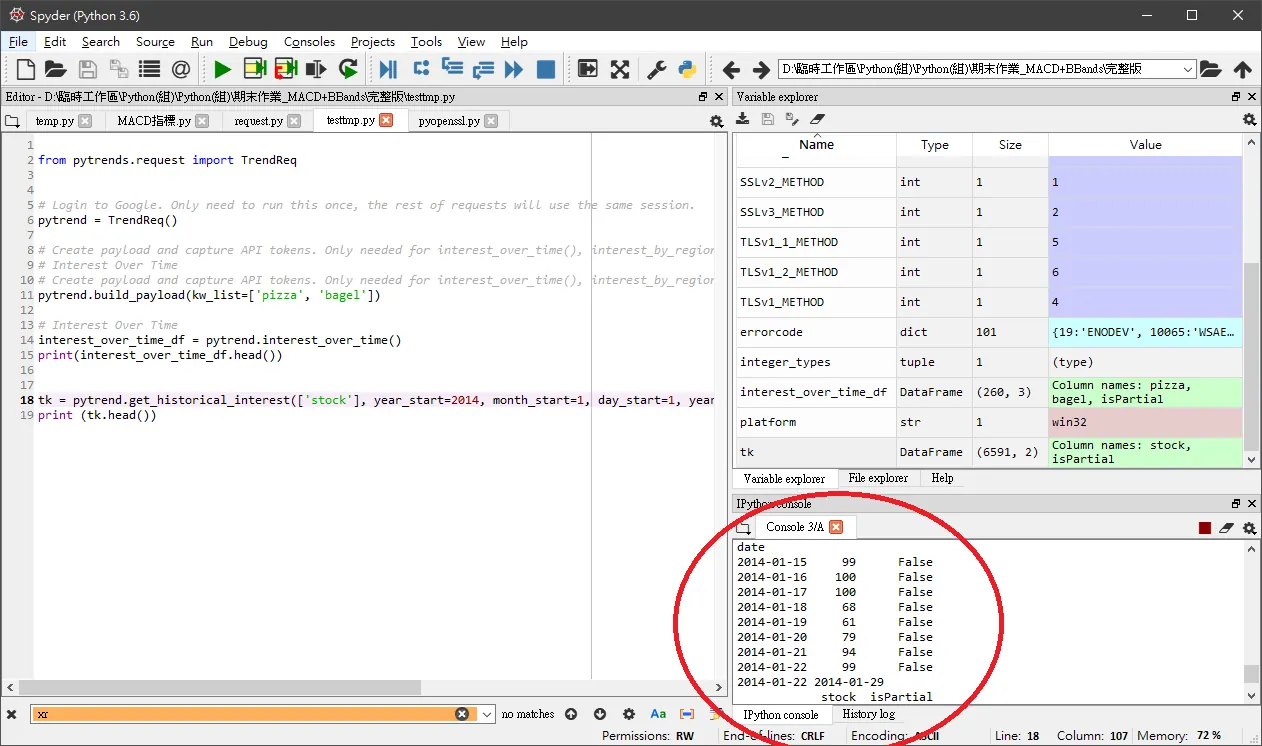
程式碼
---
from pytrends.request import TrendReq


# Login to Google. Only need to run this once, the rest of requests will use the same session.
pytrend = TrendReq()


tk = pytrend.get_historical_interest(['stock'], year_start=2014, month_start=1, day_start=1, year_end=2014, month_end=10, day_end=1, cat=0, geo='', gprop='', sleep=0)
print (tk.head())
結論
---
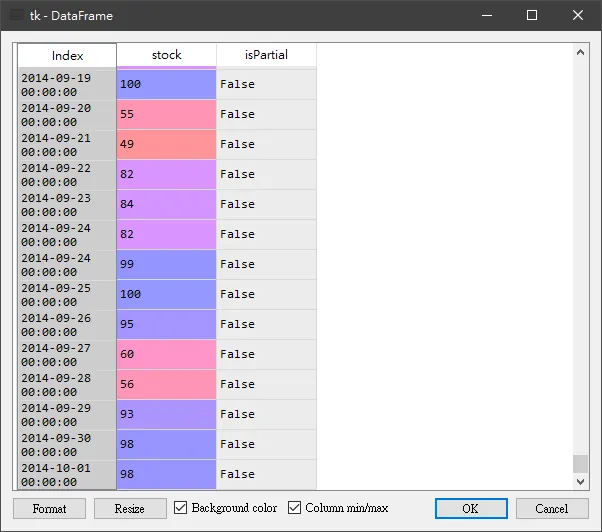
還蠻方便的可以快速地取得搜尋熱度,在github還有更多使用方法,希望早日可以找尋其中較穩的組合。
Comments