
繪製BBand與爬蟲
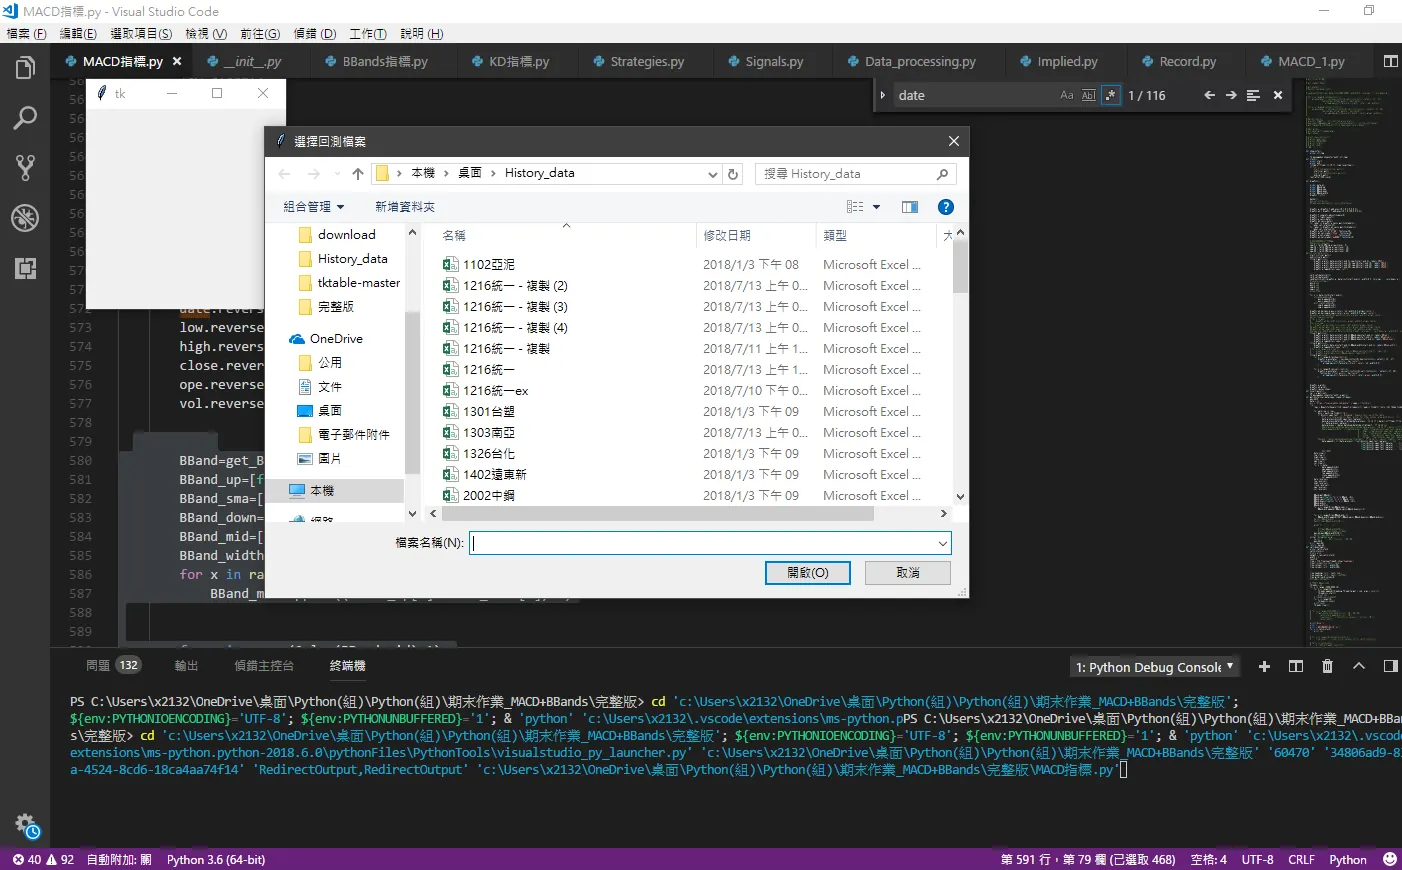
--- 技術指標用的好,也要批量選股,我們先來看初步繪圖成果吧新增了選擇檔案,稍微改了一下介面,等等批量股票篩選(暫不小心用太多執行續被官網鎖IPQQ
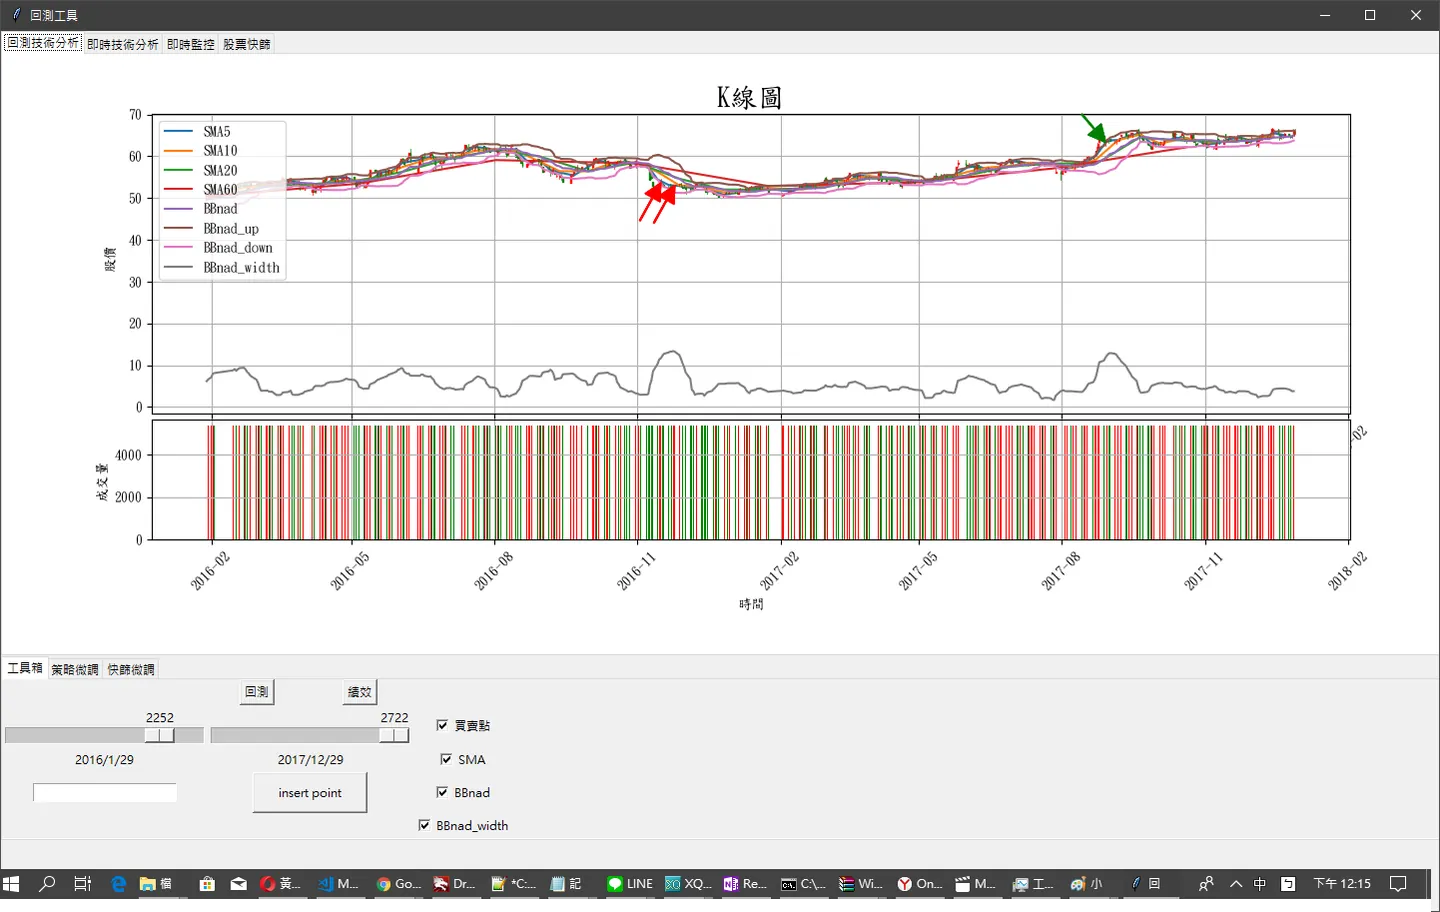
BBAND.py
BBand=get_BBand()
BBand_up=[float(x) for x in BBand  [0]]
BBand_sma=[float(x) for x in BBand  [1]]
BBand_down=[float(x) for x in BBand  [2]]
BBand_mid=[]
BBand_width=[]
        for x in range(0,len(BBand_sma),1):
            BBand_mid.append((BBand_up[x]+BBand_down[x])/2)


        for x in range(0,len(BBand_mid),1):
            BBand_width.append(100*((BBand_up[x]-BBand_down[x])/BBand_mid[x]))
爬蟲與篩選
#近三個月 bb寬度篩選
# 建立 5 個子執行緒
    threads = []
    for x in range (1000,9000,10):
        for i in range(10):
            threads.append(threading.Thread(target = job, args = (x+i,)))
            threads[i].start()
            print (i)
        # 等待所有子執行緒結束
        for i in range(10):
            threads[i].join()
        print (x+i)
        threads.clear()
         # 子執行緒的工作函數
def job(num):
    # global catch_stock
    # tmp=''
    # if(get_historical_data(str(num)+'.TW', 90)>20):
    #     catch_stock.append(str(num)+'.TW')
    #     tmp=str(num)+'.TW'
    print (get_historical_data(str(num)+'.TW', 90))

def get_historical_data(name, number_of_days):
    max_bb=0
    data = []
    url = "https://finance.yahoo.com/quote/" + name + "/history/"
    try:
        rows = BeautifulSoup(urllib.request.urlopen(url).read()).findAll('table')[0].tbody.findAll('tr')

        for each_row in rows:
            divs = each_row.findAll('td')
            if divs[1].span.text  != 'Dividend': #Ignore this row in the table
                #I'm only interested in 'Open' price; For other values, play with divs[1 - 5]
                date_process=divs[0].span.text.replace(",", "")
                date_process=datetime.strptime(date_process, '%b %d %Y').date().strftime('%Y/%m/%d')
                t = date_process.replace('/','-')
                date_process = (dates.date2num(datetime.strptime(t, '%Y-%m-%d')))
                #date_process=datetime.datetime.strptime(date_process, '%b %d %Y').date().strftime('%m %d %Y')
                #data.append({'Date': str(date_process), 'Open': float(divs[1].span.text.replace(',',''))\
                                                    # , 'High': float(divs[2].span.text.replace(',',''))\
                                                    # , 'Low': float(divs[3].span.text.replace(',',''))\
                                                    # , 'Close': float(divs[4].span.text.replace(',',''))\
                                                    # , 'Volume': float(divs[6].span.text.replace(',',''))})
            #datas2 = (dates.date2num(datetime.strptime(t, '%Y-%m-%d')) , ope[x], high[x], low[x],close[x],vol[x])#
                data.append([ str(date_process), float(divs[1].span.text.replace(',',''))\
                                                    ,  float(divs[2].span.text.replace(',',''))\
                                                    ,  float(divs[3].span.text.replace(',',''))\
                                                    ,  float(divs[4].span.text.replace(',',''))\
                                                    ,  float(divs[6].span.text.replace(',',''))])
                #篩選指標
        date.clear()
        low.clear()
        high.clear()
        close.clear()
        ope.clear()
        vol.clear()
        for x in data:
                date.append(x[0])
                ope.append(x[1])
                high.append(x[2])
                low.append(x[3])
                close.append(x[4])
                vol.append(x[5])
        date.reverse()
        low.reverse()
        high.reverse()
        close.reverse()
        ope.reverse()
        vol.reverse()


        BBand=get_BBand()
        BBand_up=[float(x) for x in BBand  [0]]
        BBand_sma=[float(x) for x in BBand  [1]]
        BBand_down=[float(x) for x in BBand  [2]]
        BBand_mid=[]
        BBand_width=[]
        for x in range(0,len(BBand_sma),1):
            BBand_mid.append((BBand_up[x]+BBand_down[x])/2)


        for x in range(0,len(BBand_mid),1):
            BBand_width.append(100*((BBand_up[x]-BBand_down[x])/BBand_mid[x]))
        #print (BBand_width)
        #print (max(BBand_width[20:]))

        print ('----------')

            #if(max(BBand_width[20:]))
            #return data[:number_of_days]
        max_bb=max(BBand_width[20:])
        #print (max(BBand_width[20:]))
    except  Exception as e:
        #print ('找不到所選資料,或發生異常錯誤.')
        max_bb=0
    print (max_bb)
    return  max_bb
像我想爬近三個月的成交量異常!?的股票,爬下來在分析再串自動下單!?,當然也要夠本,交易策略濾網要非常嚴謹,就可以放在家自動交易!?(後果不負責xd
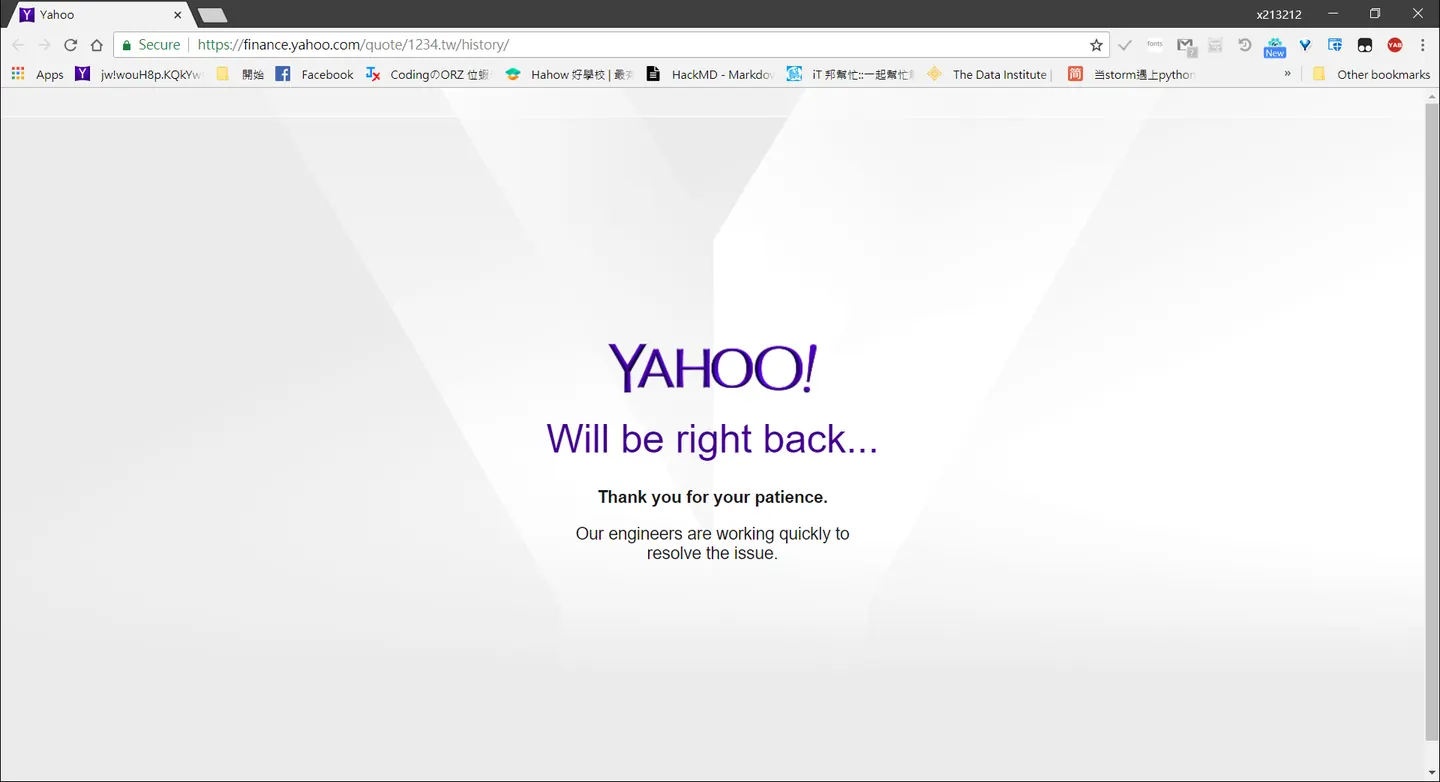
多執行緒下次調10個好了,這次不知道要被鎖幾天,被當成ddos囉
換連手機一下
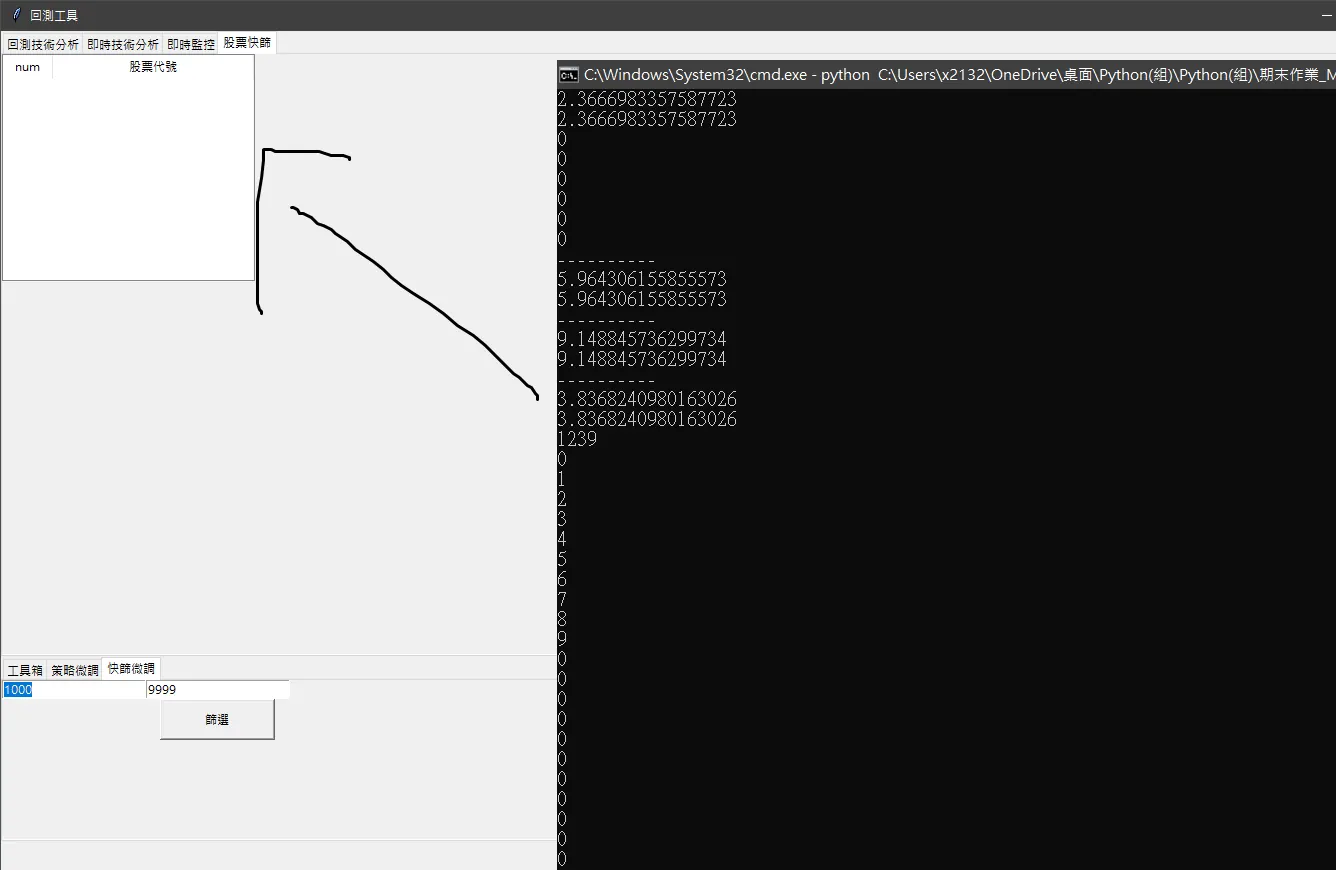
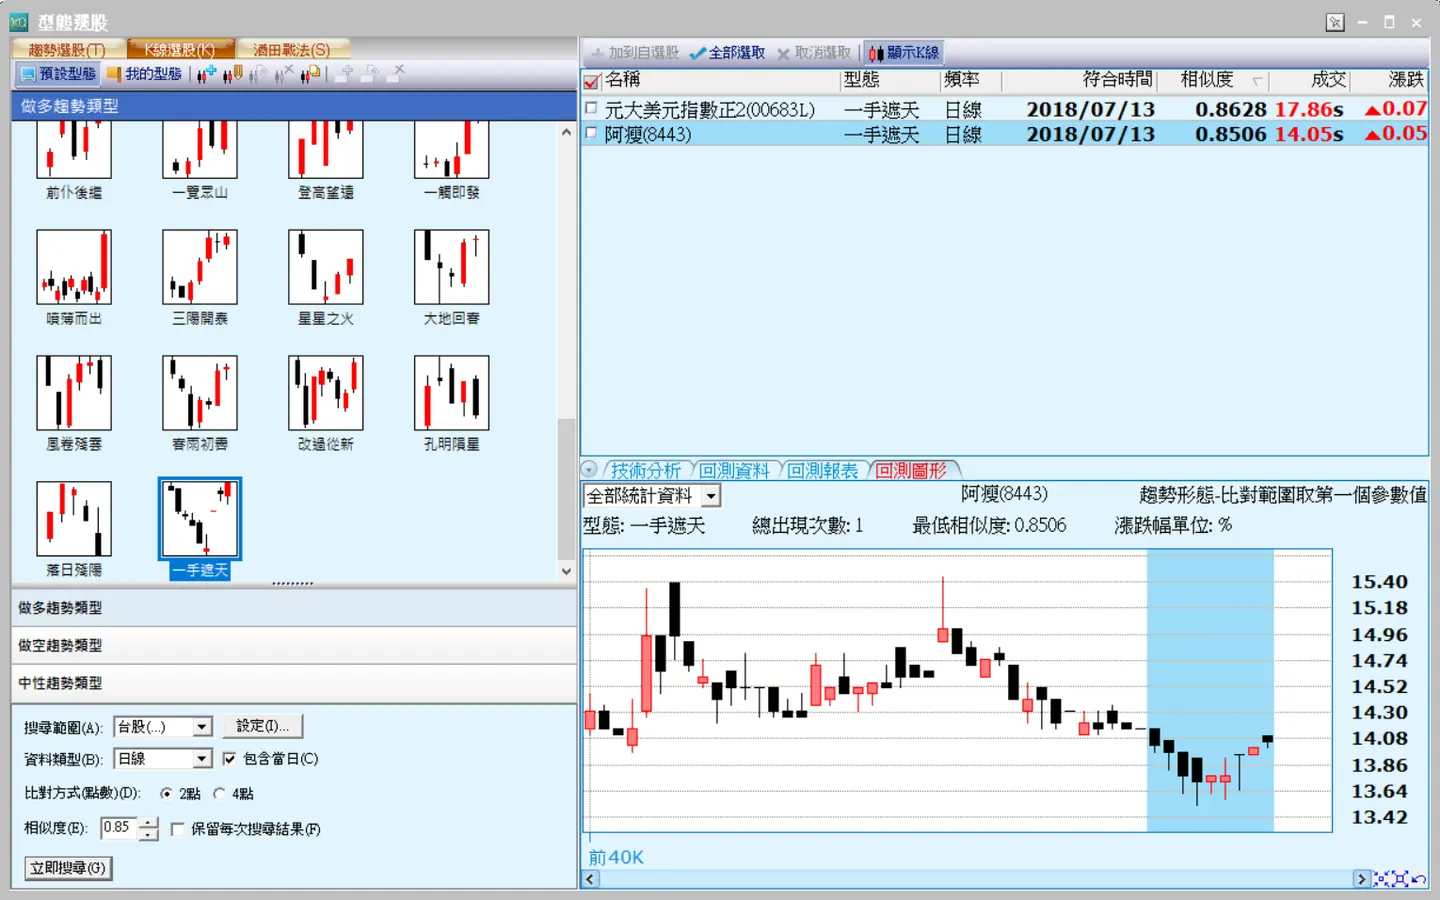 快像了快像了
下次目標
---
假設經過一票海選後,像是成交量阿還是要搜尋什麼類型的技術指標阿等等等等,我們可以把爬蟲後的資料,下再下來或倒入資料庫,下次爬蟲的時候我們只要爬,最近一筆再把他家進資料庫,這樣就可以下次不必再依賴yahoo資料庫,直接對自己資料庫要資料,我們不只可以用tick來做高頻交易(還要串api交易,你相信中華電信的網路嗎xdd,等等打造一個看盤軟體,或向xq操盤大師那樣什麼策略警示,等等,至於資料量的多寡,恩恩自己去爬吧xd,接下來我們初步就完成一個最最最最基本的自動交易軟體的雛型囉,那麼ai真的真的真的要要來看一下囉,ㄎㄎ我會不會被一堆賣課程的針對‵,應該不會它們應該更有技術含量!
Comments