
回測一波
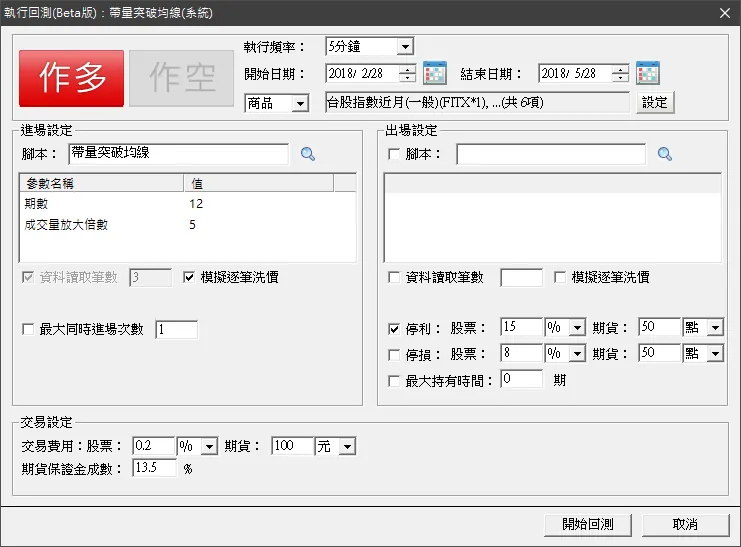
這次小研究可能要探討,中短期的技術指標,我想假設15天到30天採用不同的技術主標結算後,假設報酬率,不是最高的則,退回尋找最高回傳的報酬率,這段時間並輸出這段時間的,DATA可以詳細分析這段時間到底出了什麼事資料量越多或許可以結合ai作權重的提升,讓程式在適當的時機做出勝率最高的判斷,我想ai大概是這樣吧?!,這是下一次的目標 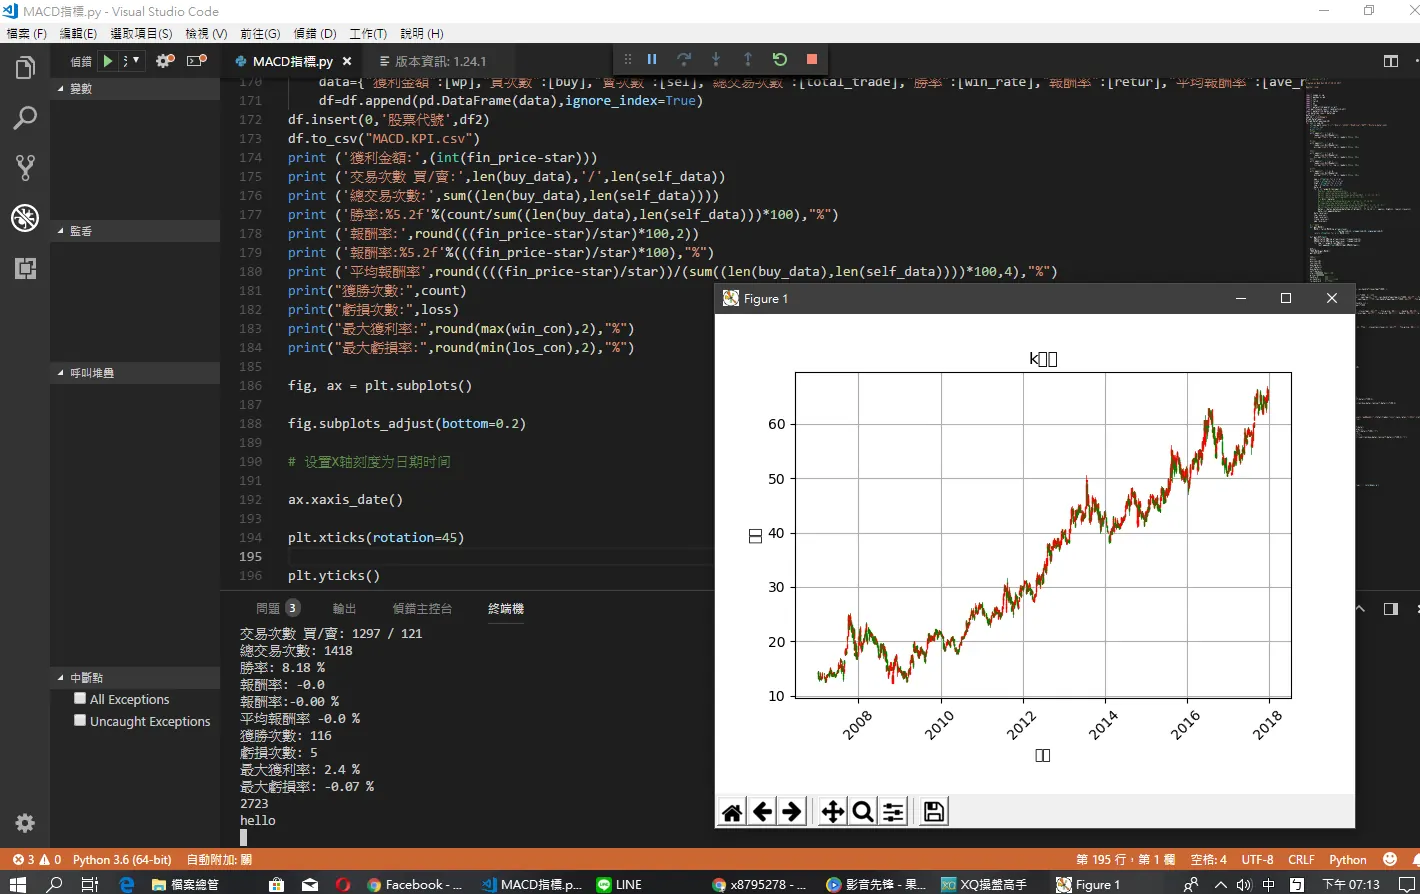 改得也不錯吧!?,樓下xq操盤高手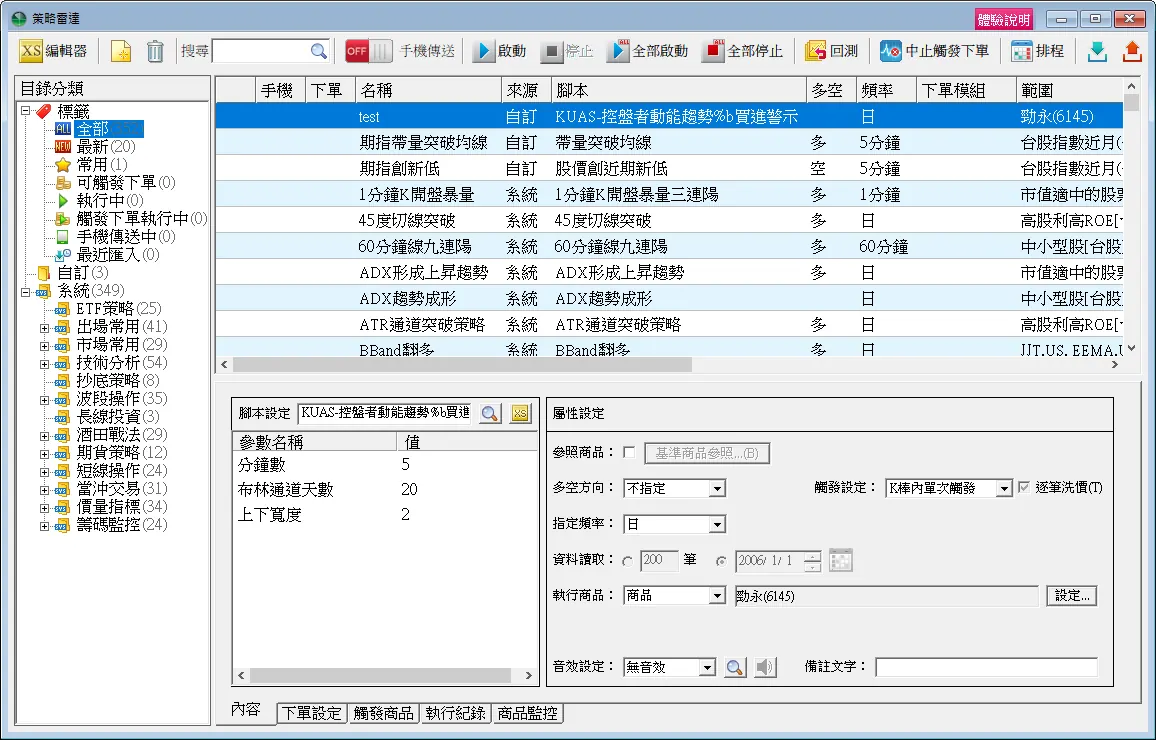
# -*- coding: utf-8 -*-
"""
Created on Wed Dec 20 17:46:15 2017

@author: user
"""


import numpy as np
import pandas as pd
import csv
import talib
import os
import time
import matplotlib.pyplot as plt
from mpl_finance import candlestick_ohlc
import matplotlib.dates as dates
from datetime import datetime
data_list = []
num_48 = ["1216統一"]
df=pd.DataFrame()
df2=pd.DataFrame(num_48)
for iii in num_48:
    str=os.path.join("C:\\","Users","x2132","OneDrive","桌面","History_data",iii)
    str=str+'.csv'
    print (str)
    #收盤
    with open(str,'r') as c:
        reader=csv.DictReader(c)
        c=[row["收盤"] for row in reader] #要導入的列

    #開盤
    with open(str,'r') as o:
        reader=csv.DictReader(o)
        o=[row["開盤"] for row in reader] #要導入的列

    #最高
    with open(str,'r') as h:
        reader=csv.DictReader(h)
        h=[row["最高"] for row in reader] #要導入的列
    #最低
    with open(str,'r') as l:
        reader=csv.DictReader(l)
        l=[row["最低"] for row in reader] #要導入的列

    #日期
    with open(str,'r') as d:
        reader=csv.DictReader(d)
        d=[row["日期"] for row in reader] #要導入的列

        ope = [float(x) for x in o]
        close = [float(x) for x in c]
        high = [float(x) for x in h]
        low = [float(x) for x in l]
        date =d
        for x in range(0,len(ope),1):
            #datess =dates.date2num(d[x])
            #print (datetime.datetime(2017, 3, 13))
            #print (dates.date2num(datetime.datetime(2017, 3, 13, 12, 0)))
            #print (datetime.datetime(2017, 3, 13, 12, 0))
            t = d[x].replace('/','-')
            #print ((dates.date2num(datetime.strptime(t, '%Y-%m-%d'))))
            # (type(datetime.datetime(2017, 3, 13, 12, 0)))
            #print (type(dates.date2num(datetime.datetime(2017, 3, 13, 12, 0))))
            #print(dates.date2num(datetime.datetime(2017, 3, 13, 12, 0)))
            datas = (dates.date2num(datetime.strptime(t, '%Y-%m-%d')) , ope[x], high[x], low[x],close[x])
            data_list.append(datas)
        date.reverse()
        low.reverse()
        high.reverse()
        close.reverse()
        ope.reverse()

    #技術指標
    def get_MACD():
        MACD = talib.MACD(np.array(close),
                                fastperiod=12, slowperiod=26, signalperiod=9)
        return [float(x) for x in MACD [1]]

    def get_DIF(test):
        EMA12=talib.EMA(np.array(close), timeperiod=12)
        EMA26=talib.EMA(np.array(close), timeperiod=26)
        for tmp in range(0,len(EMA12)):
            test.append(float(EMA12[tmp]-EMA26[tmp]))

    DIF=[]
    TRUE_MACD=get_MACD()
    get_DIF(DIF)

    #交易策略
    win=[]
    win_con=[0]
    los_con=[0]
    buy_data=[]
    self_data=[]
    buy_date=[]
    self_date=[]
    star=10000000 #一開始的錢
    price=10000000
    handle=0       #持有股數
    ex_handle=1    #持有股數上限
    re_handle=0    #實際持有

    for tmp in range(12,len(DIF)):
        if(tmp+1<len(DIF)):
            if(DIF[tmp]>TRUE_MACD[tmp] and price >= (ex_handle*close[tmp]*1000) ):
                handle= handle+ex_handle*1000
                re_handle=re_handle+ex_handle
                fin_price=price-(ex_handle*ope[tmp+1])*1000  #1=1000
                print ('買進日期',date[tmp+1],'開盤價',ope[tmp+1],'支出',(ex_handle*ope[tmp+1])*1000,'結算金額',fin_price,'持有股數',handle,'持有張數',re_handle)
                str='買進日期',date[tmp+1],'開盤價',ope[tmp+1],'支出',(ex_handle*ope[tmp+1])*1000,'結算金額',fin_price,'持有股數',handle,'持有張數',re_handle
                buy_data.append(str)
            elif (DIF[tmp]<TRUE_MACD[tmp]  and re_handle >=1 ):
                fin_price=price+(re_handle*close[tmp])*1000
                handle=0
                re_handle=0
                print ('賣出日期',date[tmp],'收盤價',close[tmp],'結算金額',fin_price,'持有股數',handle,'持有張數',re_handle)
                str='賣出日期',date[tmp],'收盤價',close[tmp],'結算金額',fin_price,'持有股數',handle,'持有張數',re_handle
                self_data.append(str)

    if (handle>0):#強制平倉
        fin_price+= (close[len(close)-1]*handle)
        handle=0
        re_handle=0
        print ('強制平倉 賣出日期',date[len(close)-1],'收盤價',close[len(close)-1],'結算金額',fin_price,'持有股數',handle,'持有張數',re_handle)


#回測績效 - 交易次數
    count=0
    loss=0
    for a,b in zip (buy_data[:],self_data[:]):
         buy_date.append(a[3])
         self_date.append(b[3])
         if buy_date[0]<self_date[0]:
             count+=1
         else:
             loss+=1
         del buy_date[0]
         del self_date[0]

    for a,b in zip (buy_data[:],self_data[:]):
         buy_date.append(a[3])
         self_date.append(b[3])
         if len(buy_date)>0:
             z=(self_date[0]-buy_date[0])/buy_date[0]
             if z>0:
                win_con.append(z)
             elif z<0:
                los_con.append(z)
         del buy_date[0]
         del self_date[0]
    for tmp in buy_data:
        print (tmp)
    for tmp in self_data:
        print (tmp)

    wp=int(fin_price-star)
    buy=len(buy_data)
    sel=len(self_data)
    total_trade=sum((len(buy_data),len(self_data)))
    win_rate=round(count/sum((len(buy_data),len(self_data)))*100,2)
    retur=round(((fin_price-star)/star)*100,2)
    ave_retur=round((((fin_price-star)/star))/(sum((len(buy_data),len(self_data))))*100,4)
    win_num=count
    los_num=loss
    max_win=round(max(win_con),2)
    min_los=round(min(los_con),2)


    data={"獲利金額":[wp],"買次數":[buy],"賣次數":[sel],"總交易次數":[total_trade],"勝率":[win_rate],"報酬率":[retur],"平均報酬率":[ave_retur],"獲利次數":[win_num],"虧損次數":[los_num],"最大獲利率":[max_win],"最大虧損率":[min_los]}
    df=df.append(pd.DataFrame(data),ignore_index=True)
df.insert(0,'股票代號',df2)
df.to_csv("MACD.KPI.csv")
print ('獲利金額:',(int(fin_price-star)))
print ('交易次數 買/賣:',len(buy_data),'/',len(self_data))
print ('總交易次數:',sum((len(buy_data),len(self_data))))
print ('勝率:%5.2f'%(count/sum((len(buy_data),len(self_data)))*100),"%")
print ('報酬率:',round(((fin_price-star)/star)*100,2))
print ('報酬率:%5.2f'%(((fin_price-star)/star)*100),"%")
print ('平均報酬率',round((((fin_price-star)/star))/(sum((len(buy_data),len(self_data))))*100,4),"%")
print("獲勝次數:",count)
print("虧損次數:",loss)
print("最大獲利率:",round(max(win_con),2),"%")
print("最大虧損率:",round(min(los_con),2),"%")

fig, ax = plt.subplots()

fig.subplots_adjust(bottom=0.2)

# 设置X轴刻度为日期时间

ax.xaxis_date()

plt.xticks(rotation=45)

plt.yticks()

plt.title("k線圖")

plt.xlabel("時間")

plt.ylabel("股價")
print (len(data_list))
candlestick_ohlc(ax, data_list[:], width=0.6, colorup='r', colordown='g')


print('hello')

plt.grid()

plt.show()
print (data_list)
Comments