
dynamic memleak detect user-space
https://zhuanlan.zhihu.com/p/133854805
https://ztex.medium.com/kprobe-%E7%AD%86%E8%A8%98-59d4bdb1e1fe
這幾篇文章有提出比較細節的架構,我這邊再順一次,補充一下一些基礎概念,總而言之,memleak.py 是如何達到攔截call function 的parameter
和return address
這邊要從stack 的概念講起
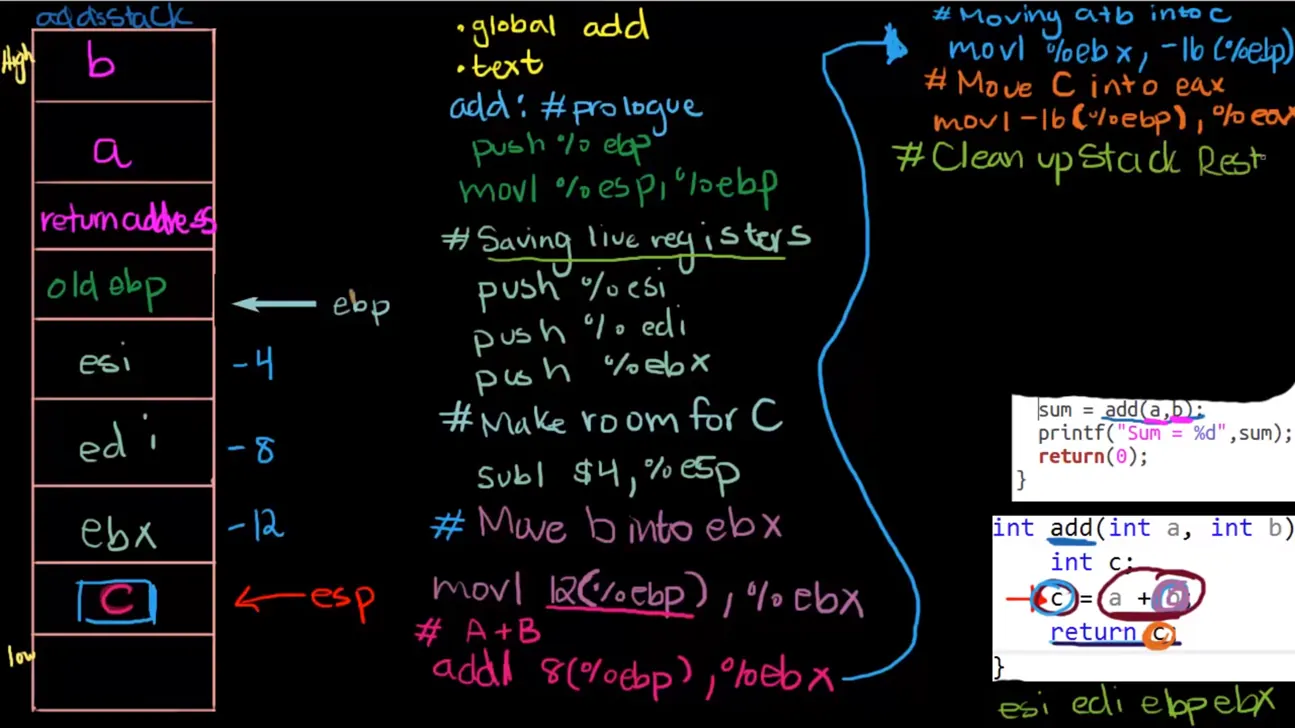
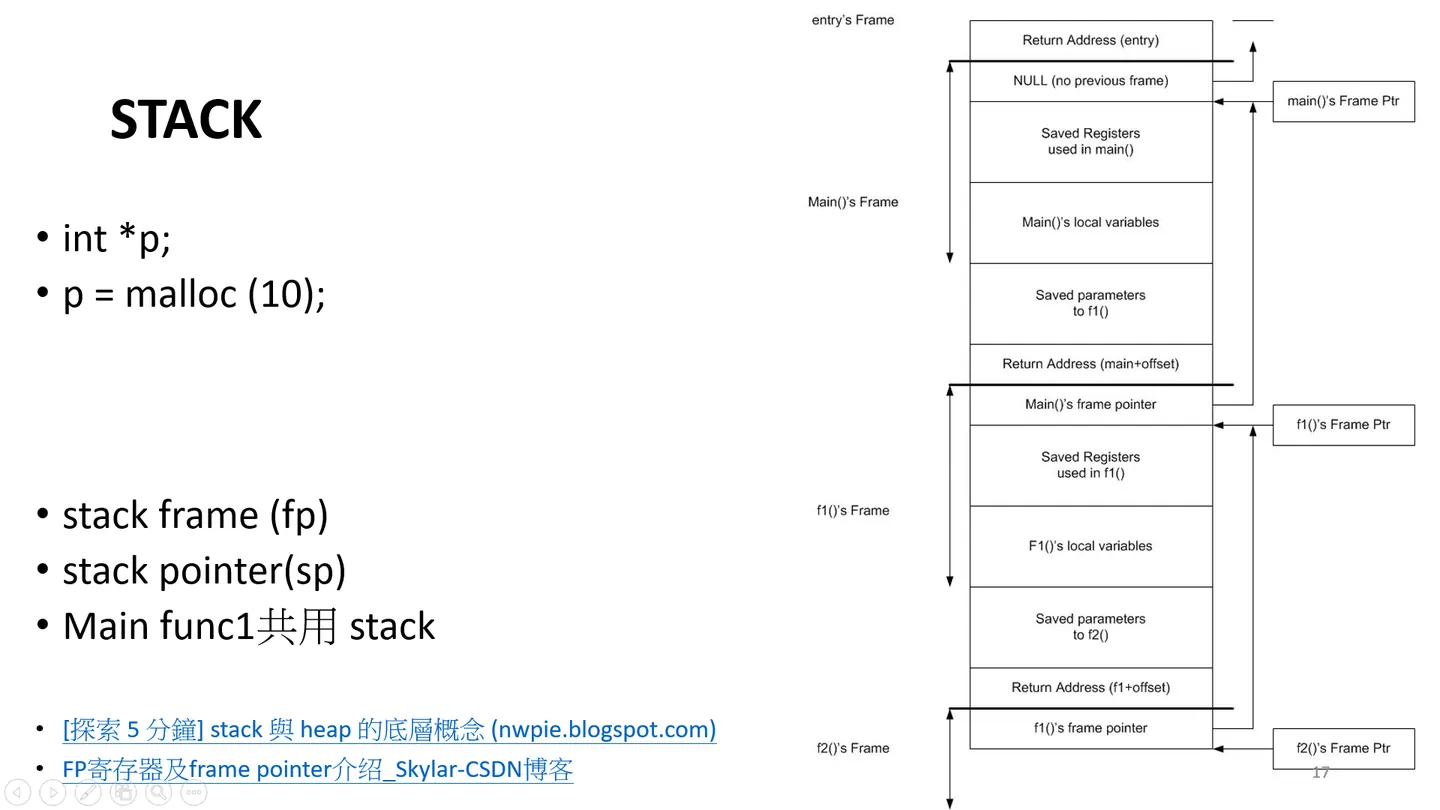 當fucntion 發生跳轉其實要存取當前的reg狀態和變數
這張是跳轉
當fucntion 發生跳轉其實要存取當前的reg狀態和變數
這張是跳轉
 這張是退出
這張是退出
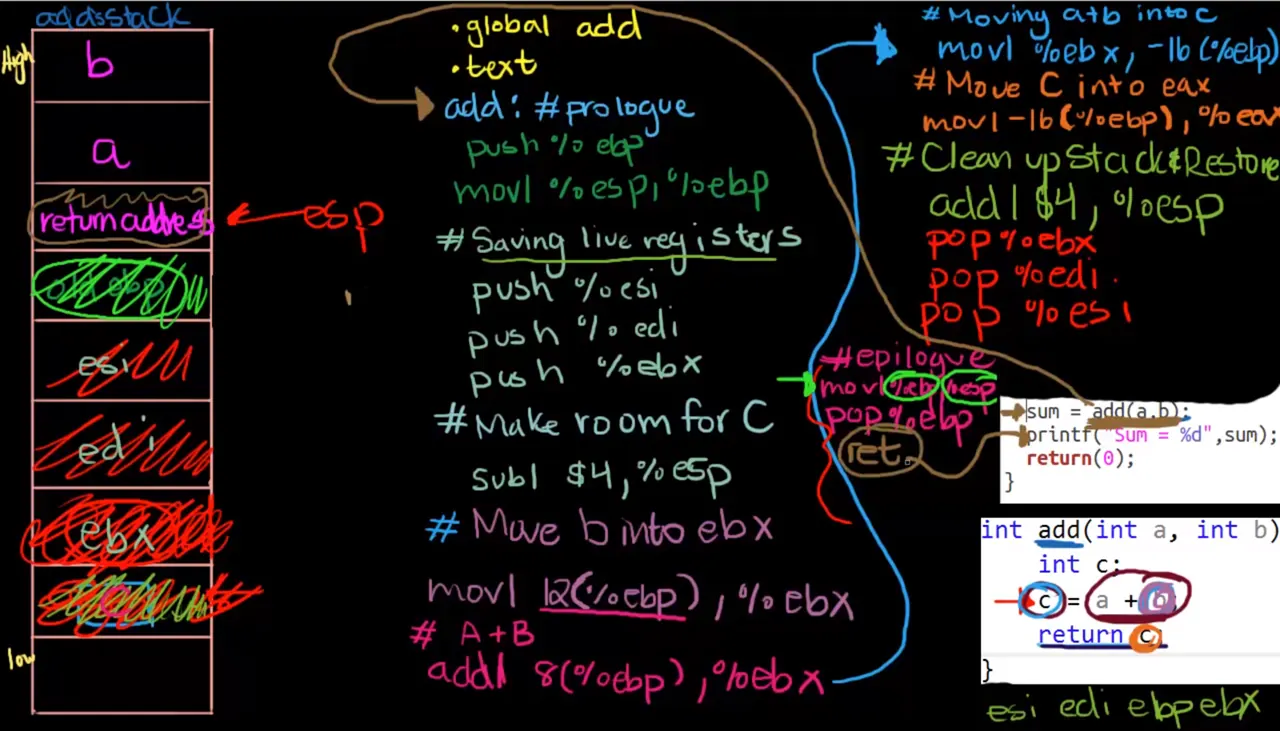
可以把ebp先做備份,esp想成永遠指向stack top,再把當前esp丟給ebp ebp等於上一次的esp,這樣就是一個frame 不管是shard lib 還是 function 它們都會共用同一個stack
也就是說他可以攔截fucnion 的 entry 和 ret的時候跳轉到自定義的fucntion,這邊是我根據example自己土炮的一小部分bpf script
#!/usr/bin/python

from __future__ import print_function

import ctypes as ct
from bcc import BPF
from time import sleep
from datetime import datetime
import resource
import argparse
import subprocess
import os
import sys
text = """
#include <uapi/linux/ptrace.h>

struct data_t {
    int a;
    int b;
    int uninit_c;
    int t;
    u64 IPAddr;
};

BPF_PERF_OUTPUT(events);

int test(struct pt_regs *ctx) {
    struct data_t data = {};

    u64 *bp = (u64 *)(ctx->bp) ;
    u64 *di = (u64 *)(ctx->di) ;
    u64 *si = (u64 *)(ctx->si) ;
    u64 *sp = (u64 *)PT_REGS_SP(ctx) ;
    u64 *fp = (u64 *)PT_REGS_FP(ctx);

    data.a = di;
    data.b =  si;

    data.IPAddr = (u64 *)PT_REGS_IP(ctx);

    bpf_probe_read(&data.uninit_c, sizeof(data.uninit_c),
     bp - 1);
    bpf_probe_read(&data.t, sizeof(data.t),
     bp - 2);
    bpf_trace_printk("SPEN addr = %x\\n", PT_REGS_IP(ctx));
    events.perf_submit(ctx, &data, sizeof(struct data_t));
    return 0;
}

int test2(struct pt_regs *ctx) {
    struct data_t data = {};

    u64 *bp = (u64 *)(ctx->bp) ;
    u64 *di = (u64 *)(ctx->di) ;
    u64 *si = (u64 *)(ctx->si) ;
    u64 *sp = (u64 *)PT_REGS_SP(ctx) ;
    u64 *fp = (u64 *)PT_REGS_FP(ctx);

    data.a = di;
    data.b =  si;

    data.IPAddr = (u64 *)PT_REGS_IP(ctx);

    bpf_probe_read(&data.uninit_c, sizeof(data.uninit_c),
     bp - 1);
    bpf_probe_read(&data.t, sizeof(data.t),
     bp - 2);
    bpf_trace_printk("SPEN addr = %x\\n", PT_REGS_IP(ctx));
    events.perf_submit(ctx, &data, sizeof(struct data_t));
    return 0;
}
"""

examples = """
EXAMPLES:

./memleak -p $(pidof allocs)
        Trace allocations and display a summary of "leaked" (outstanding)
        allocations every 5 seconds
./memleak -p $(pidof allocs) -t
        Trace allocations and display each individual allocator function call
./memleak -ap $(pidof allocs) 10
        Trace allocations and display allocated addresses, sizes, and stacks
        every 10 seconds for outstanding allocations
./memleak -c "./allocs"
        Run the specified command and trace its allocations
./memleak
        Trace allocations in kernel mode and display a summary of outstanding
        allocations every 5 seconds
./memleak -o 60000
        Trace allocations in kernel mode and display a summary of outstanding
        allocations that are at least one minute (60 seconds) old
./memleak -s 5
        Trace roughly every 5th allocation, to reduce overhead
"""

description = """

Trace outstanding memory allocations that weren't freed.
Supports both user-mode allocations made with libc functions and kernel-mode
allocations made with kmalloc/kmem_cache_alloc/get_free_pages and corresponding
memory release functions.
"""
parser = argparse.ArgumentParser(description=description,
        formatter_class=argparse.RawDescriptionHelpFormatter,
        epilog=examples)
parser.add_argument("-O", "--obj", type=str, default="c",
        help="attach to allocator functions in the specified object")
args = parser.parse_args()
obj = args.obj
b = BPF(text=text)
b.attach_uprobe(name=obj, sym="foo", fn_name="test")
b.attach_uretprobe(name=obj, sym="foo", fn_name="test2")
class Data(ct.Structure):
    _fields_ = [
        ("a", ct.c_int),
        ("b", ct.c_int),
        ("uninit_c", ct.c_int),
        ("t", ct.c_int),
        ("IPAddr", ct.c_longlong),
    ]

def print_event(cpu, data, size):

    event = ct.cast(data, ct.POINTER(Data)).contents
    print("a: %d, b: %d, uninit_c: %d, t: %d, ipaddress: %d" % (event.a, event.b, event.uninit_c, event.t, event.IPAddr))

# loop with callback to print_event
b["events"].open_perf_buffer(print_event)
while 1:
    b.kprobe_poll()
注意到
b.attach_uprobe(name=obj, sym="foo", fn_name="test") b.attach_uretprobe(name=obj, sym="foo", fn_name="test2")
參數可以下 sudo python3 bpftest2.py -O /home/x213212/test3/test
接obj檔
因為普通沒加上偏移量就是對應到foo sym
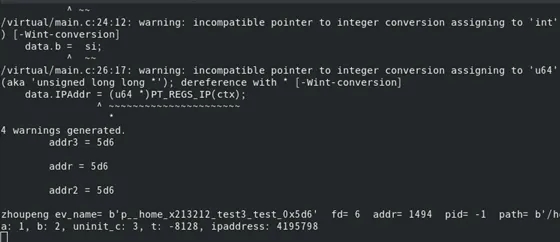
如果要在foo 偏移位置點進行hook只要調整對應objdump 偏移量即可
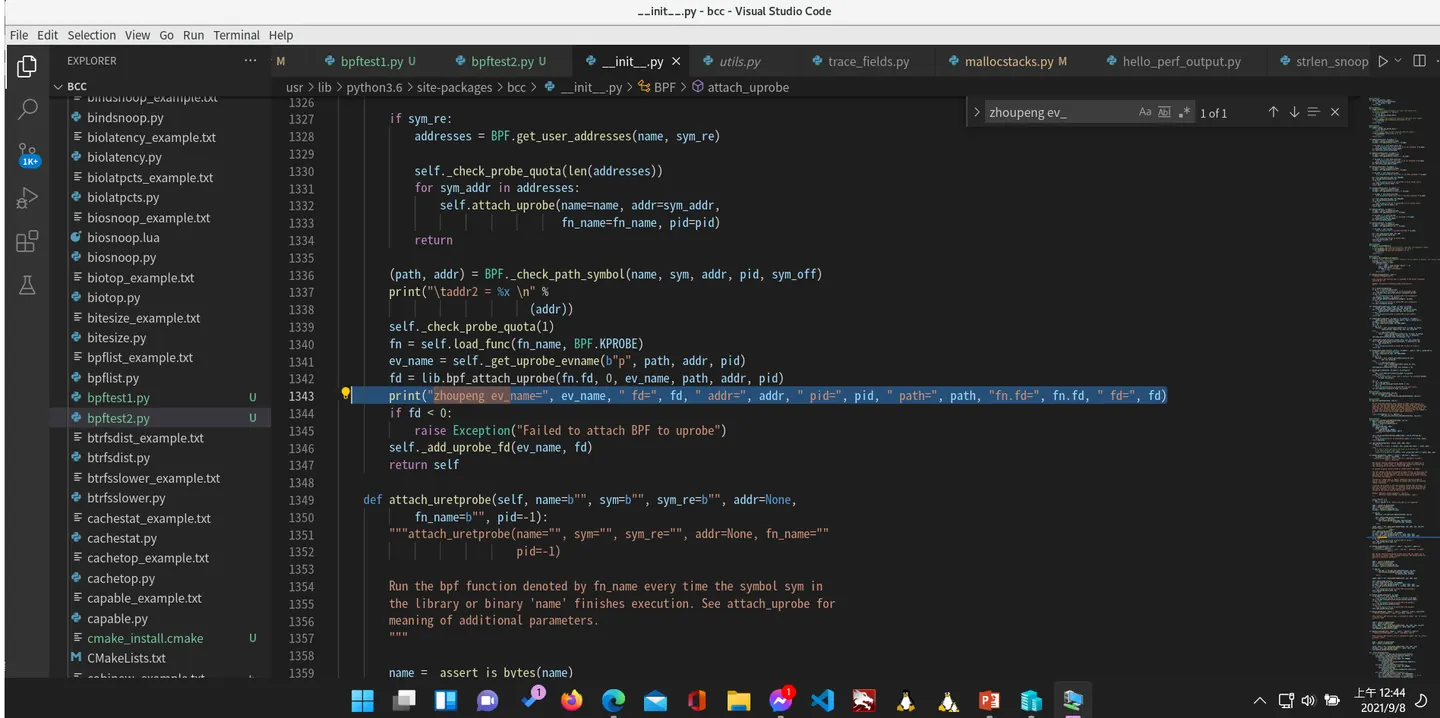
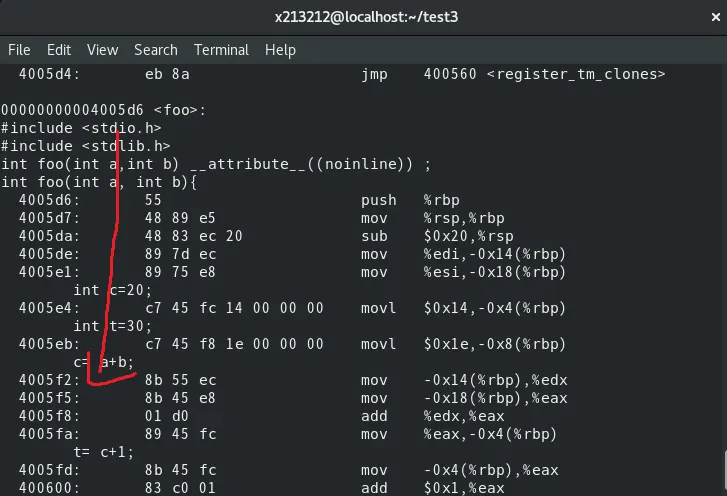
這邊可以看到add 假設我要偏移到5f2則在偏移加上28偏移
必須要異動__init__.py 去攔截裡面的載入 sym function 對應obj的偏移量
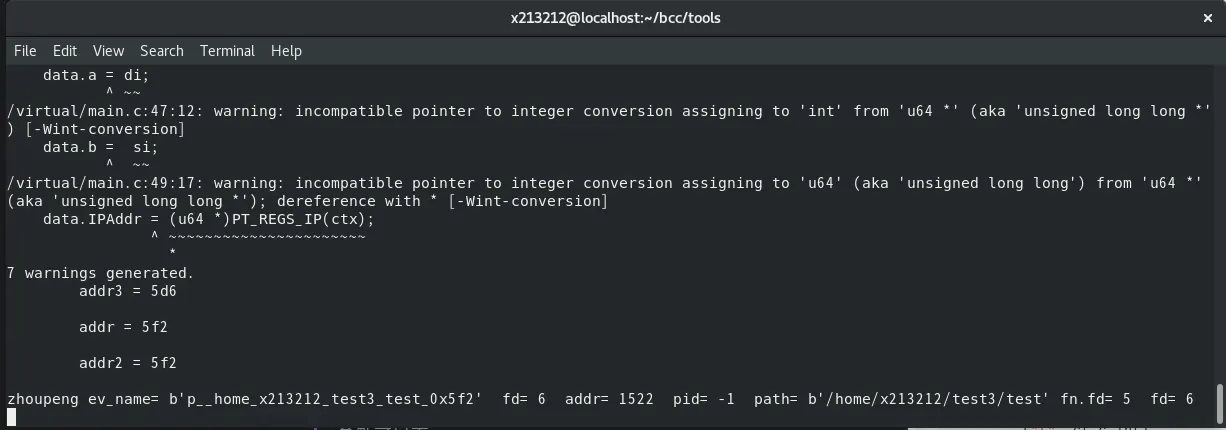
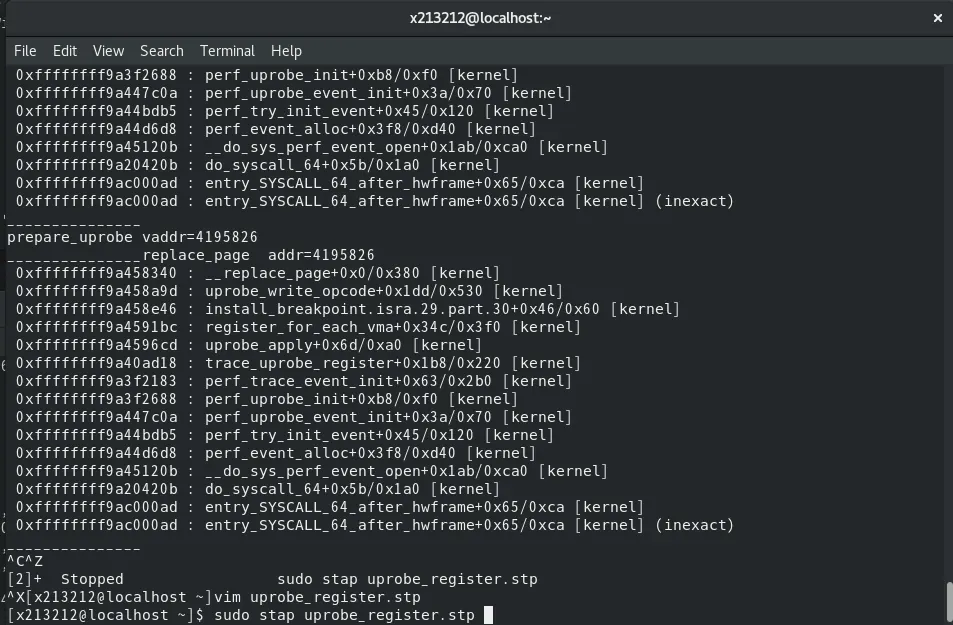
real address = base address + offset sudo stap uprobe_register.stp
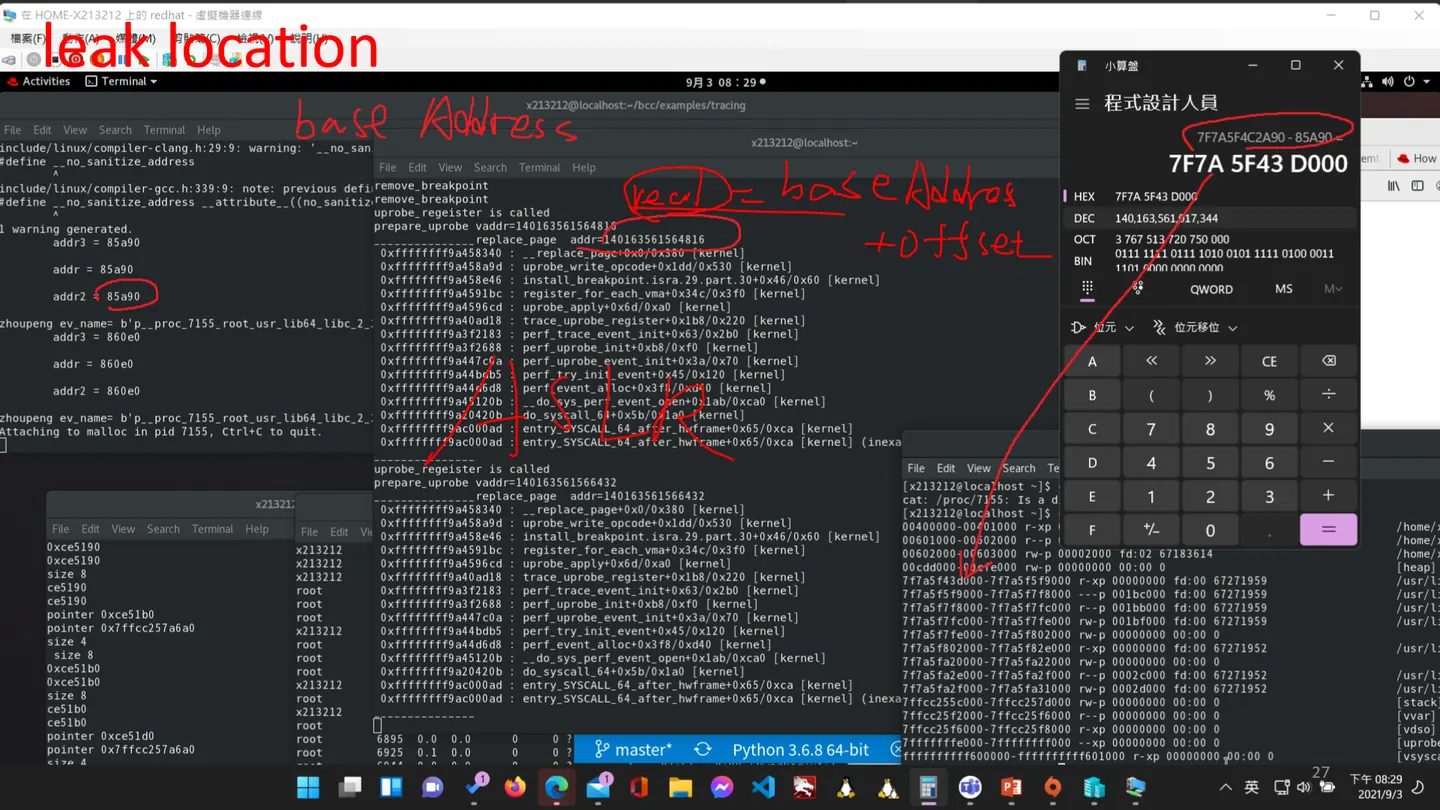 這個腳本可以讓我在runtime的時候取得任意process 執行程式的載入process的虛擬記憶體位置,有這個後,我就可以根據這些去反推obj偏移和虛擬記憶體位置
probe kernel.function("uprobe_register"){
        print ("uprobe_regeister is called\n")
}

probe kernel.function("__replace_page"){
        printf ("_______________replace_page  addr=%d\n", $addr)
                print_backtrace();
        printf ("_______________\n")
}

probe kernel.function("prepare_uprobe"){
        printf ("prepare_uprobe vaddr=%d\n", $vaddr)
}

probe kernel.function("remove_breakpoint"){
        printf ("remove_breakpoint\n")
}

probe kernel.function("unapply_uprobe"){
        printf ("unapply_uprobe\n")
}
也就是對應到
Cat /proc/{pid}/maps
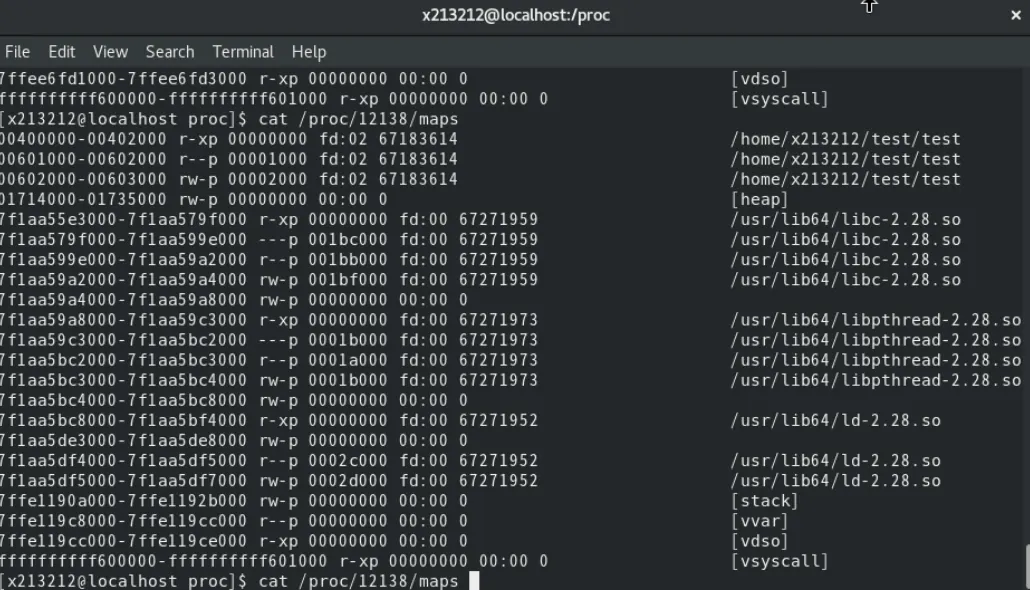 推出位置後,可以去稍微看一下memleak 的位置
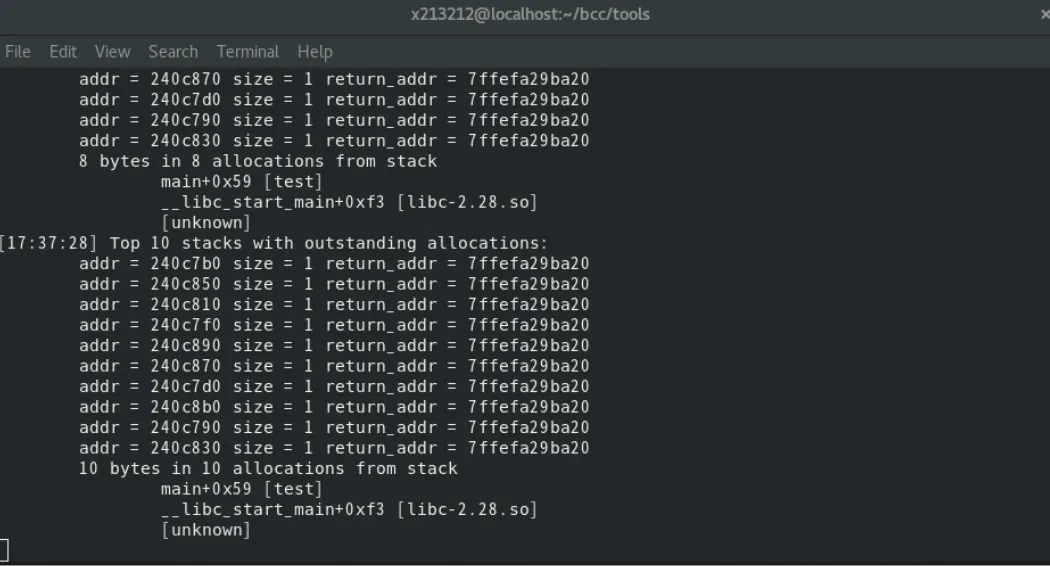 其實就是對應到maps的位置,偏移量也就是觸發hook fucntion後返回的address,到這邊其實就可以完成一個小型gdb。
Comments